When an asset price is not moving in an uptrend or a downtrend, but instead bouncing between two parallel levels, then you have a sideways market. It is easy to visually identify a sideways market on a chart, but the real problem is how to identify it at the beginning. The good news is that this can be done using technical tools and indicators. This article covers 4 ways how to identify sideways market in Forex or any other market.
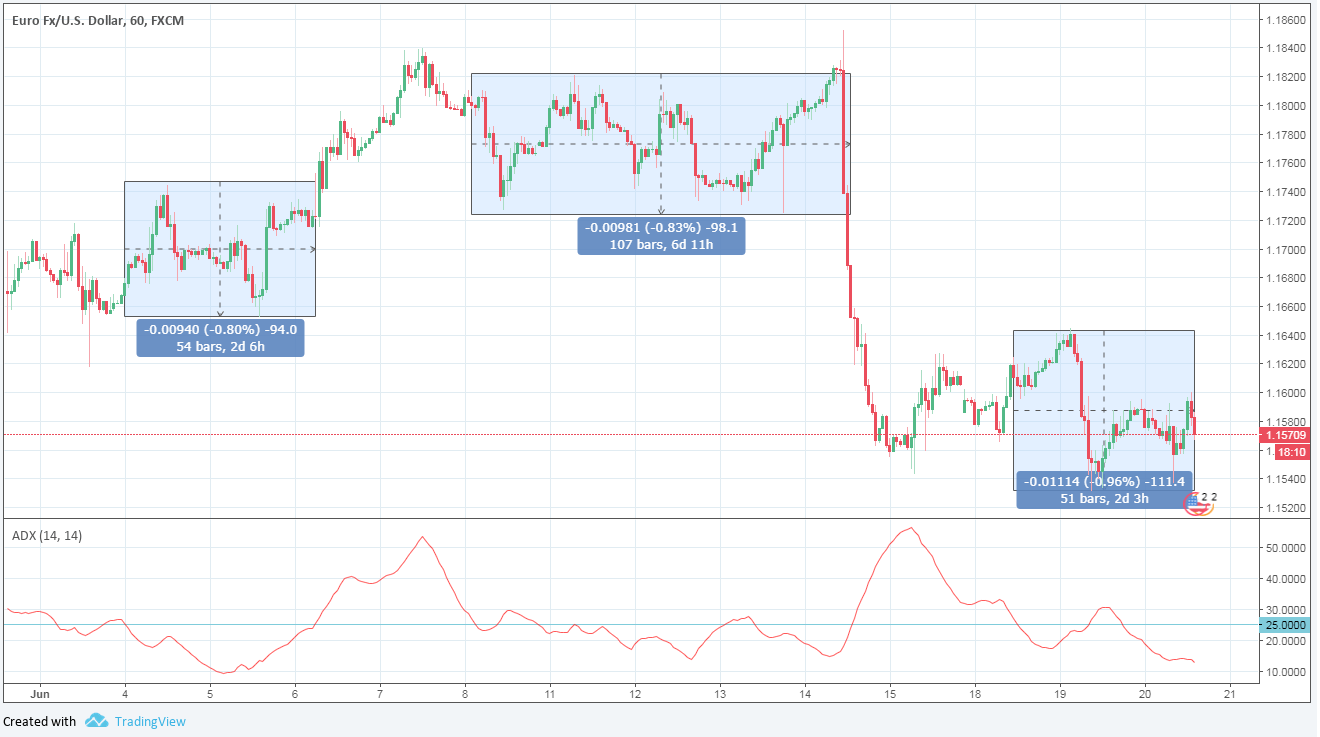
1. ADX Under 25
The Average Directional Index, or ADX, is a technical tool that tells us if an asset is moving in a clear direction (either up or down) or is moving sideways. High ADX values (around 30 or higher) can be interpreted as an instrument whose price is predominantly moving up or down. Low ADX values (around 25 or lower) can be interpreted as an instrument whose price is predominantly moving sideways. Adding ADX, your chart will filter out the ranging markets from the trending markets.

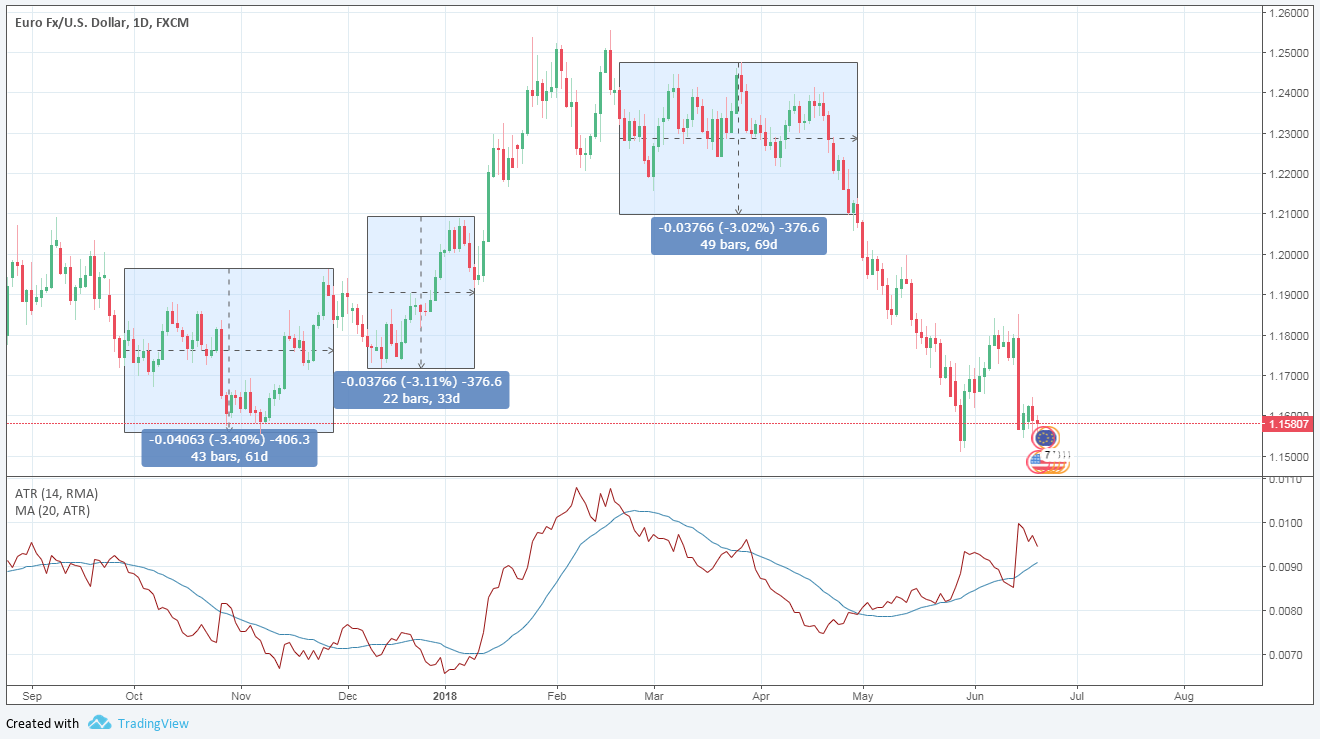
2. ATR Below 20-Period Moving Average
The Average True Range, or ATR, is a technical tool that displays the average difference between the most recent candles’ highs and lows. Because ATR values are not normalized like some indicators, it’s important to compare the current ATR value to historical ATR values for the same asset. This is where the 20-Period Moving Average of the ATR becomes useful. Adding ATR with a 20-Period Moving Average of the ATR and only allowing it to trade when ATR is below the Moving Average will filter out the big bull and big bear runs and hone in more on ranges.
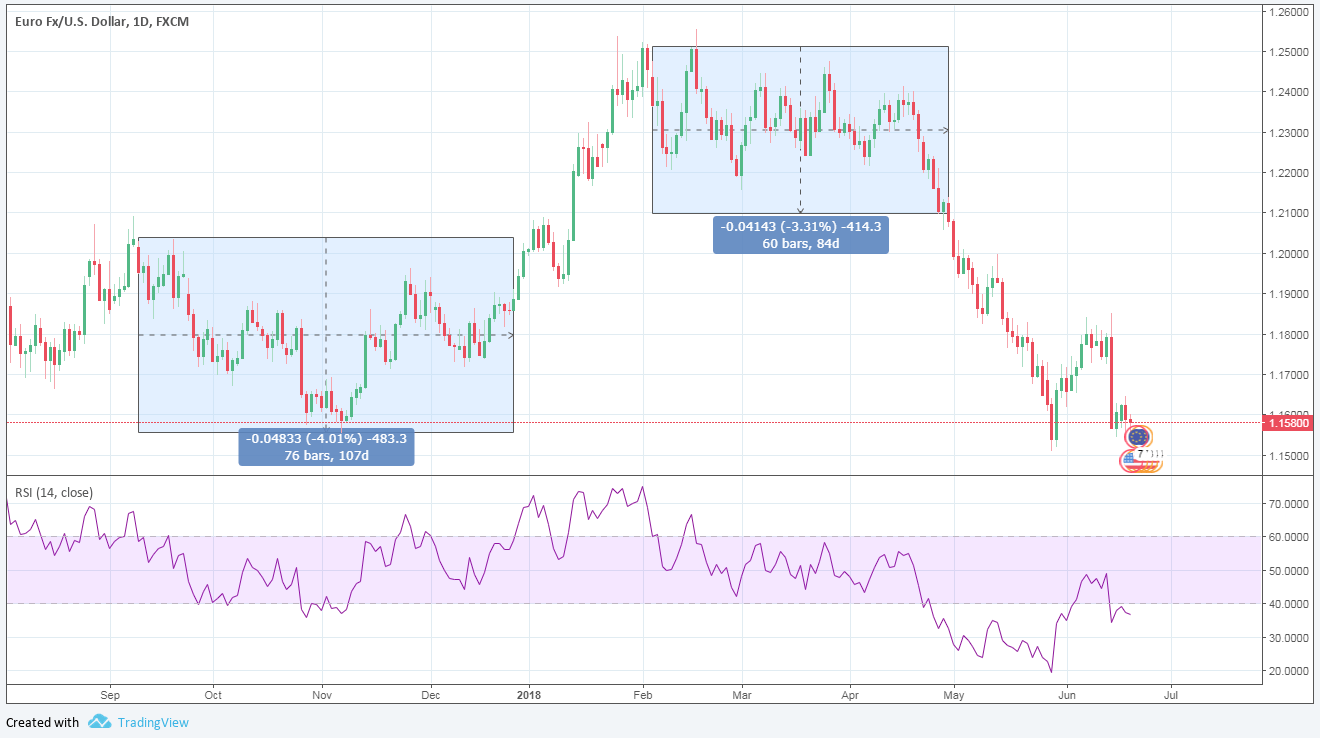
3. RSI Between 40 and 60
The Relative Strength Index, or RSI, is a technical tool that displays how strongly the price is moving up or down. Traditionally, traders look at RSI values above 70 to define strong bullish moves and RSI values below 30 to define strong bearish moves. But for a range trading strategy, we can identify a higher likelihood of range bound action when RSI rests between 40 and 60.
4. Multi-time Frame Analysis
If you are not sure whether the market is trending or ranging, you can do a quick multiple time frame analysis on the asset’s higher and lower time frames before placing a trade. For example, if you are trading on an H1 chart, you can check the M5 chart to ensure that the trend is in the same direction and similarly check the H4 chart to ensure that the higher time frame price is also moving in the same direction. If multiple time frame charts confirm a similar trend, then it is considered a very strong trend and ideal for Trend trading.
So there you have it, 4 simple ways how to identify sideways market on any chart.


MTF Analysis should be number 1. QQE is way better than ADX, ATR, and RSI.
Why didn’t you include Crocodile indicator and BB Squeeze?