
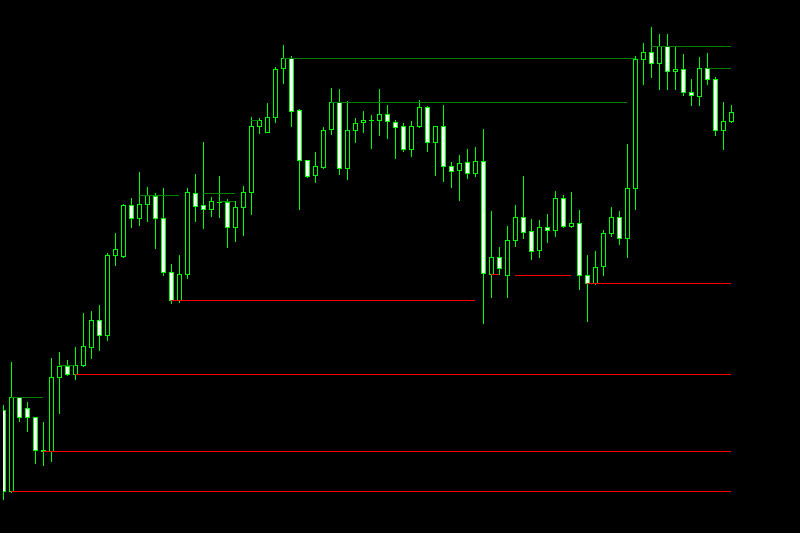
The Support and Resistance Lines indicator automatically plots the support and resistance lines at different price levels on the chart. The green lines show the resistance level and the red lines show the support level.
How to use this indicator:
Trade the “Bounce”
– Buy when the price falls towards support.
– Sell when the price rises towards resistance.
Trade the “Break”
– Buy when the price breaks up through resistance.
– Sell when the price breaks down through support.
Tip: To help you filter out the false breakouts, you should think of support and resistance more as “zones” rather than concrete numbers. Check out the Support and Resistance Zones indicator.
This is a MetaTrader 4 (MT4) indicator and works with all currency pairs and all timeframes. Once you download and install the indicator, it will appear in your trading chart, like the image shown above.
This Download is for VIP Members Only. Not a VIP Member? Join & Get Instant Access Now.


