The Auto Fibonacci MT5 Indicator (or Auto Fibos) automatically detects two key price reversal points on a chart and draws Fibonacci lines between them.
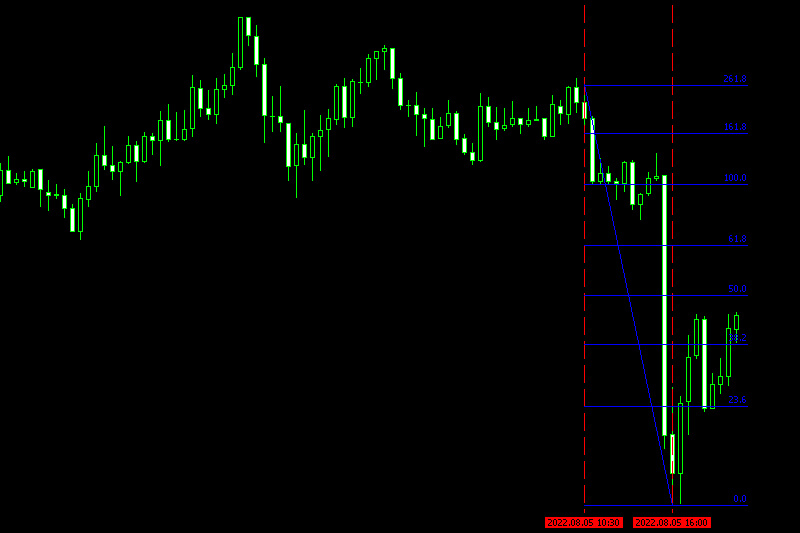
The Auto Fibos indicator finds two extreme price points on a chart and divides the vertical distance by the Fibonacci ratios. The starting point of the retracement is 0.00 percent, while 100.00 percent signifies a complete reversal to the original position of the motion. The most key Fibonacci levels are 23.600%, 38.20%, and 61.80%, which are horizontally placed on the price grid to pinpoint potential price reversal areas.
Technical analysis studies like Elliott Wave theory, Gartley patterns, and Tirone levels can all benefit from the Auto Fibonacci Indicator. Furthermore, unlike moving averages, the Fibonacci retracement is a static price point. Identifying Fibonacci levels is easy because of their static nature, allowing traders and investors to anticipate price reversals.
How to use the indicator
Fibonacci retracement levels are used to identify buy zones after a bull market pullback and shorting zones following a bear market rebound. It is generally best to use momentum indicators like MACD and Stochastics to improve your chances of accurately identifying the best trade entry. When a Fibonacci level overlaps with a turning point in an indicator, the expected support or resistance becomes even stronger.
Depending on the depth of the Auto Fibonacci Indicator (Auto Fibos) Indicator For MT5, a 23.60 percent retracement that occurs during flag or pennant consolidation patterns is seen as being quite shallow. Shallow retracements happen often, but to make money from them, you need to keep an eye on the market and be ready to trade quickly. Pullbacks that range from 38.20% to 50.00% are regarded as moderate and occur during wedge and triangle formations.
The most important Fibonacci level for traders to be aware of is 0.618, which is the inverse of the golden ratio (1.618). Most of the time, a countertrend reversal stops at the 0.618 retracement, where the last buyers or sellers give up and the price goes back to its larger trend. Before entering a trade, most traders wait for a bullish or bearish candlestick to close above or below a Fibonacci level to establish the validity of support or resistance.


