
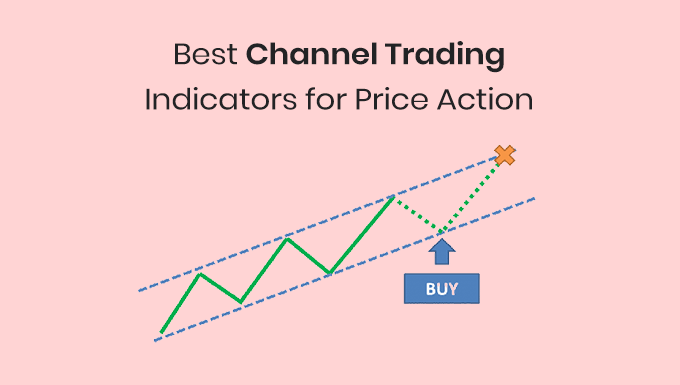
Channel trading indicators are a great way to look at the charts visually. A price channel is formed by two or more parallel lines. When the channel is drawn in a higher time frame, it usually works better. So, it is better to use these channel trading indicators in a higher time frame as there is less market noise.
These channels are very flexible and can be used to identify trends, determine momentum, and figure out stop-losses.
In this article, I will explain six popular channel trading indicators that will be useful to any price action trader.
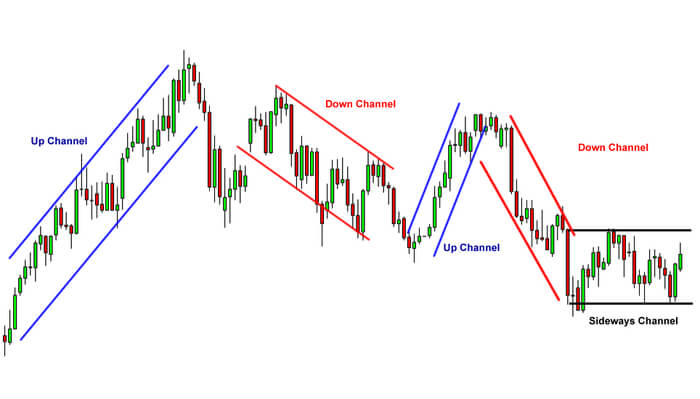
What is Channel Trading?
In channel trading, you use technical indicators that show areas of support and resistance. Traders may use this data to decide whether to open a buy or sell trade and also to assess market volatility levels.
Support and resistance are two different price levels that seem to limit how an asset’s price moves. Support is where the price of an asset might stop falling, and resistance is where the price might stop going up.
In channel trading, a trader opens a long position when the price of an asset finds support and opens a short position when the price finds resistance. This is based on the idea that an asset’s price would retrace when it finds either support or resistance.
How to Trade Price Channels?
There are two ways to trade price channels.
You can either trade with the trend or trade the breakout after the trend has ended.
In order to trade the trend, you will have to take a position that goes with the overall direction of the trend, such as buying when the trend is going up and selling when it is going down.
Also remember that, during a small retracement, you could open a position in the opposite direction of a trend, which could lead to a more permanent change.
If this is the case, you would want to enter into the trend early, like when the price first hits support or resistance, so that you may benefit from any long-term price movement that goes against the current trend.
Trading the breakout means that you open a position on any price action that breaks through the upper or lower band of the channel.
For example, if the asset’s price goes above the upper band of a channel, you may open a long position; if the price goes below the lower band, you could open a short position.
Types of Channel Trading Indicators
Most price channels use a smoothing formula to calculate the midline. Then, it creates a channel with a certain amount of volatility to include price action. (e.g., Bollinger Band)
Price action techniques, like swing highs and lows, are used to draw trend lines in hand-drawn channels. The same price factors also help us turn the trend line into an envelope. (e.g., Trend Line Channel)
Some channels use a mix of both approaches. The linear regression channel, for example, uses statistical calculations while it’s attached to a strong swing pivot.
This article will focus on the six channel trading indicators below.
- Moving Average Channel
- Keltner Channel
- Bollinger Bands
- Linear Regression Channel
- Donchian Channel
- Trend Line Channel
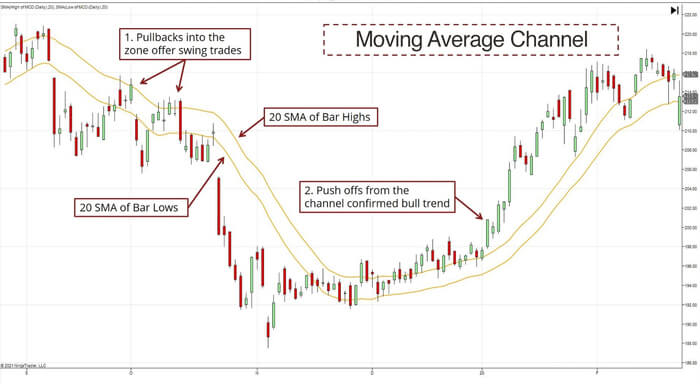
1. Moving Average Channel
This channel is simple to understand and doesn’t require any complex calculations. All you need are two moving averages.
The idea is very simple. On a price chart, the high and low of each bar represent the support and resistance for each time period. These are important values.
For example, on a daily chart, the high of a candle is the highest point of resistance during the day.
So, we use the high and low prices to create two moving averages. When these two moving averages are plotted together, they form the moving average channel.
The chart below shows you how to create the channel. It also shows how it helps a swing trader identify market opportunities.
2. Keltner Channel
The Keltner Channel is an envelope-based indicator that uses an exponential moving average (EMA) as the center line, with an Average True Range (ATR) of previous price action.
In the example below, many traders would get a buy signal when the bar on the far left of the price graph broke above the Keltner channel’s upper band. They would have made a profit if they had done so, since the price of the asset continued to rise.
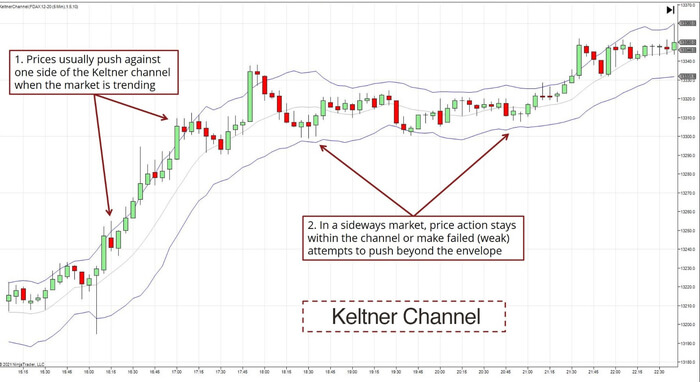
As you can see above, the Keltner Channel is a simple way to look at the market phase in a visual way. With its help, you can quickly tell if the market is in a trend or stuck in a range.
The Keltner channel indicator filters out unimportant information about small price movements because it is based on an exponential moving average and the average true range.
Therefore, some traders think that the Keltner channel gives a more accurate picture of an asset’s overall volatility over a given period of time than the other channel trading indicators on this list.
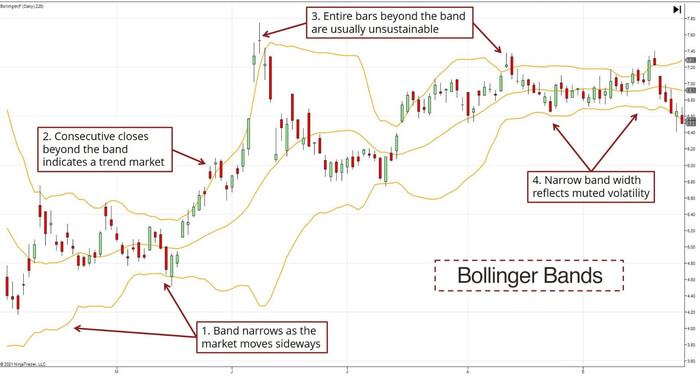
3. Bollinger Bands
John Bollinger’s Bollinger Bands is a common indicator that is available on most trading platforms.
Many traders use Bollinger Bands to find areas of market volatility, and they think that the more the bands move away from the SMA, the more volatile the market is.
When the bands are narrow, this means that the underlying market price is more stable.
Bollinger Bands are built in a way that is similar to the Keltner Channel and uses standard deviation instead of ATR, which is the main difference.
This difference is important because it makes Bollinger Bands bit more unstable. If you compare the Keltner Channel and Bollinger Band side by side, you will notice one big difference.
That is, Bollinger Bands expand and contract much more frequently and irregularly than Keltner Channel bands.
Some beginners might feel confused with the way these bands change. But experienced traders know that the changes in the width of the band tell important information. So, they can take advantage of these changes.
The chart below shows how useful the Bollinger Bands are for analyzing price action.
4. Linear Regression Channel
A linear regression line is the best-fit line that goes through all the data points. It uses a key statistical idea called the method of least squares.
In a price chart, the closing price of each bar is usually used as a data point. But you can also use the median price or the average price.
Once the best-fit line is set, we can draw the channel by projecting two parallel lines. The standard deviation determines how far apart these lines are.
Linear regression requires calculations. But picking the correct range of data points manually is essential to its success.
Usually, you start the linear regression line at the point where the trend started. Then, modify it to incorporate more price action as the market goes on.
The channel is more useful when it has at least two valid swing highs and lows, like the circled ones in the chart below.
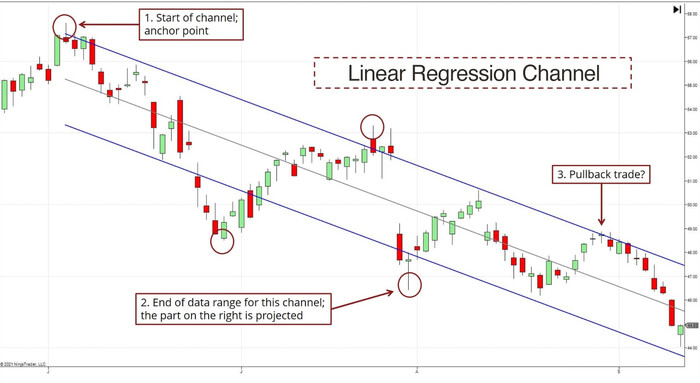
In this example, the channel lines are two standard deviations from the regression line. This multiplier is one of the parameters of a linear regression channel.
Remember that as new data comes in, the entire linear regression channel changes. That is because it is a “repainting indicator”. So, be careful when you manually backtest this indicator.
Regression channels often look great after the fact because they are, by definition, the best-fit line. So, don’t forget to take note of how much data the channel handles.
5. Donchian Channel
Donchian channels display the difference between an asset’s current price and its prior trading ranges. This data can be used to detect the market’s volatility and any possible breakouts, retracements, or reversals.
It has three bands. The upper and lower bands are based on the highest high and lowest low for a given period, while the middle band is the average of the two.
Traders typically use a 20-day period for a Donchian channel, and the width of the channel indicates how volatile the underlying market is.
If the bands are narrow, the market is stable. On the other hand, if the bands are wide, the market is considered volatile.
Let’s take period N for example.
With this setting, the channel draws two lines that show the highest and lowest prices of the last N periods, respectively. By taking the average of the two lines, it also makes a midline.
On a weekly chart, a 52-period Donchian Channel makes it easy to find new 52-week highs and lows. A trader looking for good entries could have used the application below.
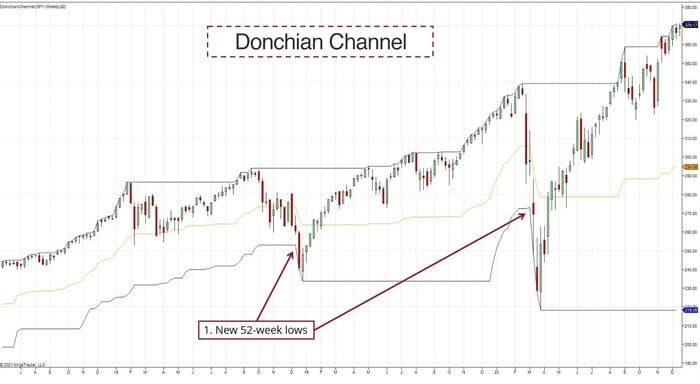
The indicator’s simple design makes it easy to understand. So, it is a very useful tool for identifying trading opportunities, particularly for trend-following.
6. Trend Line Channel
The trend line channel is one of the most important tools I use when I trade. You only need to know how to identify swing highs and lows to be able to draw them for your analysis.
Follow these two steps to get a bullish trend line channel:
- Connect two swing lows and draw an upward sloping trend line.
- Draw a line parallel to the trend line that is attached to the highest point between the two swing lows.
Follow these two steps to get a bearish trend line channel:
- Connect two swing highs and draw a downward sloping trend line.
- Draw a line parallel to the trend line that is attached to the lowest point between the two swing highs.
The chart below is an example.
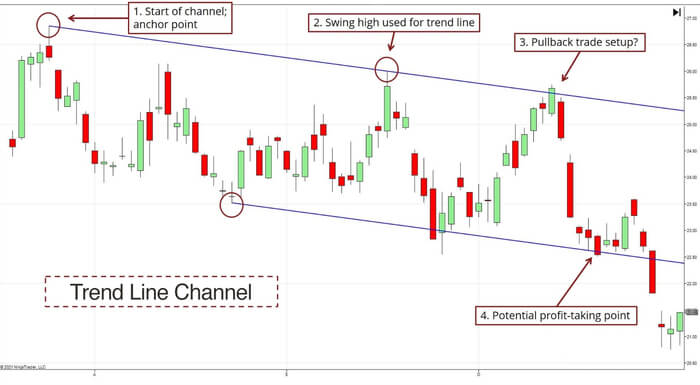
As you can see above, a good channel makes it easy to find pullback trades and profit target levels.
Trend line channels are also very useful for figuring out how the market is moving during the day.
There are many ways to draw trend lines, but you must be consistent with whatever method you use.
Conclusion
Channel trading indicators are very useful tools for price action traders as they show traders possible areas of support and resistance.
Many traders believe that the price will either retrace or break out of a channel when it reaches either of these two levels. Each channel shows a different trend. A trader will usually buy or sell in a strong uptrend or downtrend but will open opposite positions if the price of an asset hits a support or resistance level.
It is best to use these indicators together to confirm a current trend, a possible retracement, or a reversal before opening a position.


