
Multiple time frame analysis is one of the popular technical analysis tools a trader can use before making any trade.
Unfortunately, many traders would like to make their trading decisions based on a single time frame. As a result, they spend most of their time analyzing the charts in their specific time frame without paying much attention to what is happening in the “Bigger Picture.” That approach can work at times, but a more sensible approach would be to look at several time frames to find high-probability trading setups.
For a beginner trader, analyzing multiple time frames could be overwhelming and even confusing at times.
For example, you may look at a 1-minute chart of the EUR/USD currency pair and see that the pair appears to be in a downtrend market.
However, if you switch to a daily chart, you may see that the currency pair has been in an uptrend market for years. So which chart is right? Is the EUR/USD pair in an upward trend, or is it in a downward trend? That’s problematic, especially when the time frames don’t always align, and there are different kinds of trends in different time frames.
As a result, some traders avoid multiple time frame analysis due to its conflicting nature and varying results.
Therefore, in this article, I will explain what multiple time frame analysis is, how to choose the best time frame combination, and how to correctly use it for day trading.
What is Multiple Time Frame Analysis?
Multiple time frame analysis is a technique for analyzing different time frames for a single currency pair before entering a trade.
This type of analysis is best applied using a top-down approach because you start with a broader view and then work your way down until you see a time frame in which you can enter a trade.
Usually, the higher time frame is used to identify a longer-term trend, while a lower time frame is used to spot ideal trading opportunities to enter the market. Thus, if there is a strong trend on a higher time frame, trading in the direction of that trend on the lower time frame will likely produce a higher probability of winning trades.
Choosing Best Time Frame Combination

The time frame combination can differ based on your trading style.
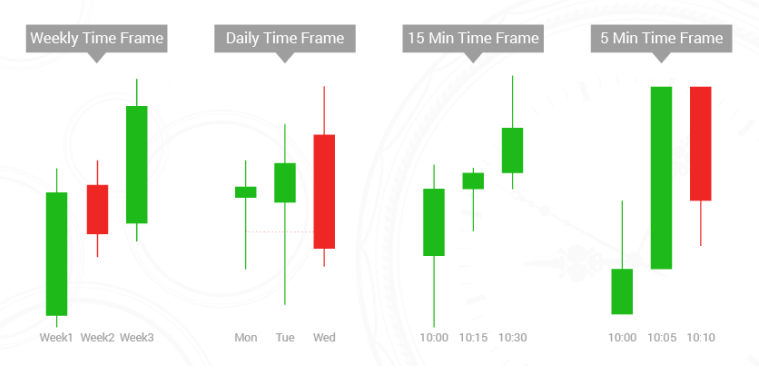
For example, a scalper would prefer a different set of time frames than a swing or a position trader. So, a trader should know how to choose the best set of forex time frames to analyze. If the time frames are too close, you won’t be able to tell the difference, which would be pretty useless. It is recommended to use the following three different time frame charts that are broad enough to read the market.
- Trend chart (Higher time frame chart) – The trend chart helps you identify the longer-term or the major trend and shows the big picture of the currency pair. For example, on the daily chart, if the EUR/USD is trading above the 200 EMA, that confirms the longer-term trend is an uptrend.
- Entry chart (Chart you typically trade) – As the name suggests, the entry chart is the chart you do all your technical analysis and place buy and sell trades. For example, if the currency pair in the Trend chart moves upwards, you should be looking for buy entries. Conversely, if the currency pair in the Trend chart moves downwards, you should be looking for sell entries.
- Signal chart (Lower time frame chart) – The signal chart helps to accurately identify the turning points and pullbacks of the trend and tell you exactly when to enter and exit a trade.
When choosing the three frames, most experienced traders suggest that time frames should be at least four times apart (1:4 ratio).
For example, if you are analyzing a trend on a 1-hour chart, the 30-minute chart will not provide anything useful that the 1-hour chart already does. But a 15-minute chart is likely to show clear cycles and price movements.
Therefore, per the “1:4 ratio”, if you use a higher time frame of 1 hour, the lower time frame should be at the maximum, 15 minutes (i.e., 60 min/4). Likewise, if you use a higher time frame of 4 hours, the lower time frame should be 1 hour.
You can use the below recommended time frame combinations.
- 1-minute, 5-minute, and 30-minute
- 5-minute, 30-minute, and 4-hour
- 15-minute, 1-hour, and 4-hour
- 1-hour, 4-hour, and daily
- 4-hour, daily, and weekly
- daily, weekly, and monthly
Multiple Time Frame Analysis Techniques
Once you’ve decided on your preferred time frame, use one of the below two techniques to analyze the time frames.
1. Using Trend Analysis
This method will only use the Trend analysis to enter a trade without using any technical indicators.
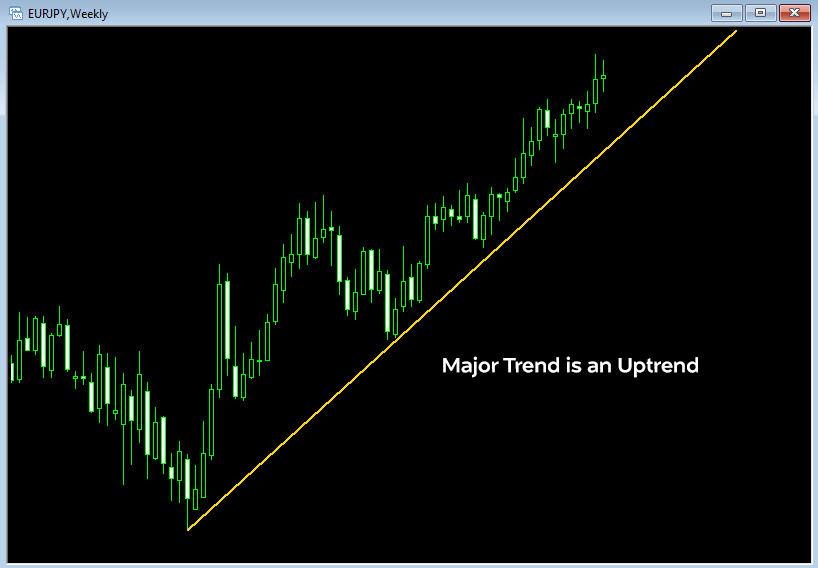
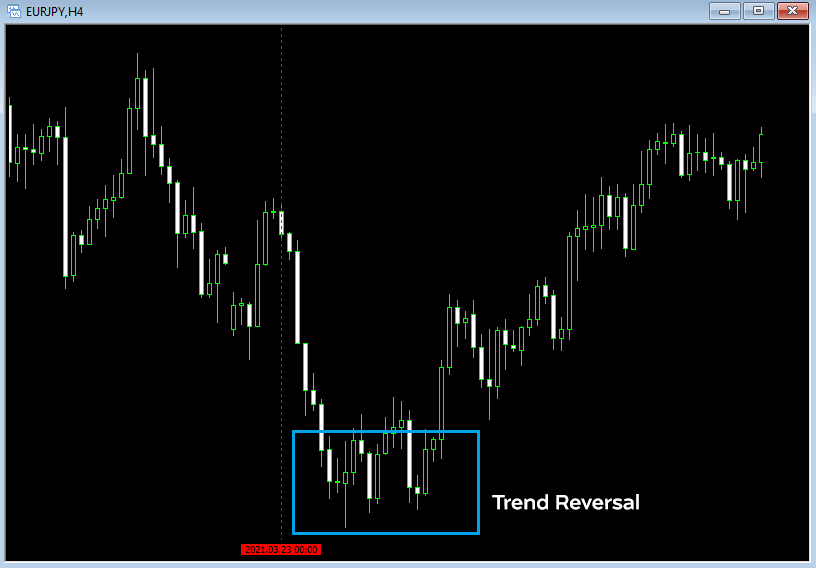
Let’s look at an example from the EUR/JPY chart using 4-hour, daily, and weekly charts.
– Higher TF: Weekly chart
– Entry TF: Daily chart
– Lower TF: 4-hour chart
First, go to the Trend chart and confirm the major trend, whether it an uptrend or a downtrend.
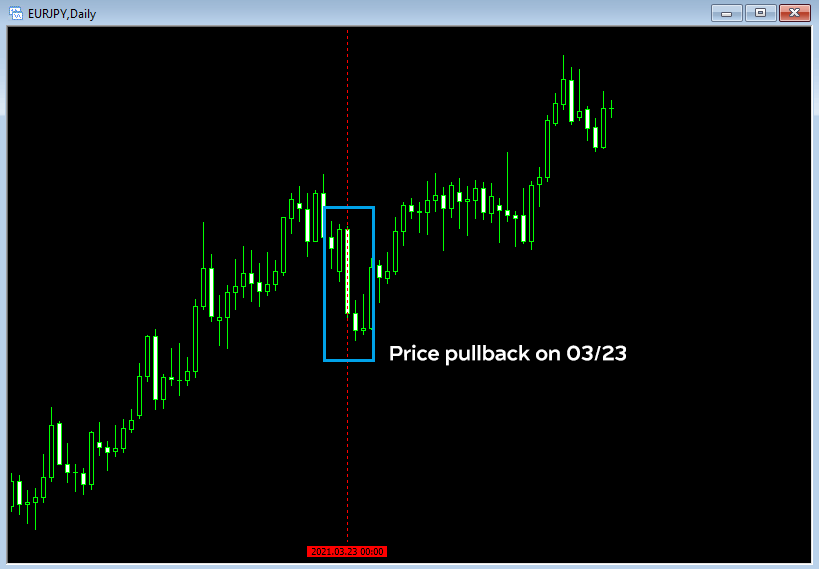
Then switch to the Entry chart and wait for the price to pull back in the opposite direction of the major trend identified on the Trend chart. After that, wait for the end of the pullback.
Then, go to the Signal chart and wait for a trend reversal where the price starts to move in the major trend direction.
Then switch back to the Entry chart and open a trade.
Set the stop loss at the previous price pull back on the Entry chart. You can keep the trade open until the trend weakens.
2. Using Technical Indicators
In this method, you will proceed with the trading decision after getting confirmation from your technical indicators or analysis. Here you can use indicators such as Moving Averages, Stochastic Oscillator, RSI, or Support and Resistance key levels that support your trading strategy.
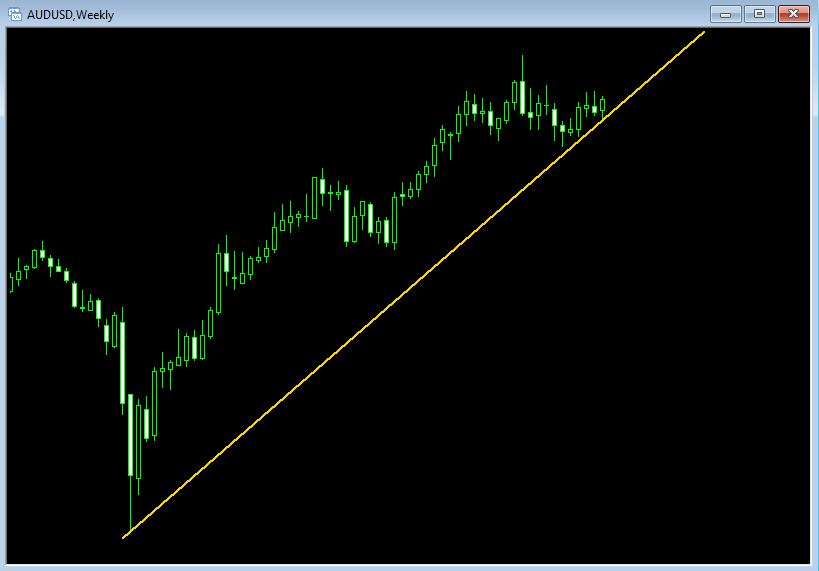
Let’s take an example from the AUD/USD chart using 4-hour, daily, and weekly charts.
– Higher TF: Weekly chart
– Entry TF: Daily chart
– Lower TF: 4-hour chart
First, go to the Trend chart and confirm the major trend. Basically, here you need to identify whether the overall trend direction is an uptrend or a downtrend. As you can clearly see on the below AUD/USD weekly chart, the currency pair has been trending up for several years.
Then, go to the Entry chart and draw your support and resistance lines. Here you need to analyze the week ahead’s potential market direction and identify valid trade areas.
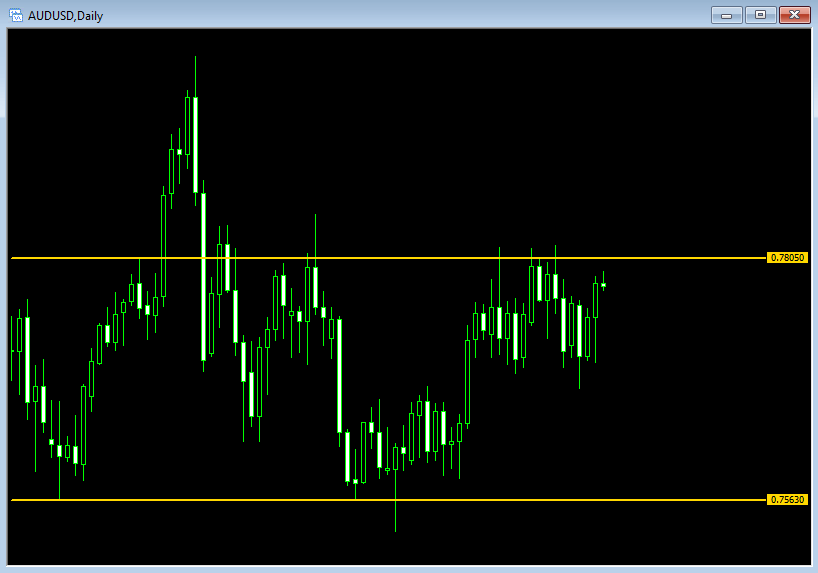
Lastly, switch to your Signal chart to identify an optimal entry point to buy the AUD/USD in the major trend direction. In this example, I will be using the RSI indicator (with a 14 period) to confirm the buy signal. As you can see on the 4-hour AUD/USD chart, the RSI is at the oversold area on 04 May 2021 as it crossed below the 40 level mark(circled in blue). Also, there is an overlapping resistance zone between the 4-hour chart and the daily chart. This indicates a strong trading zone because it’s nested inside a larger time frame zone.
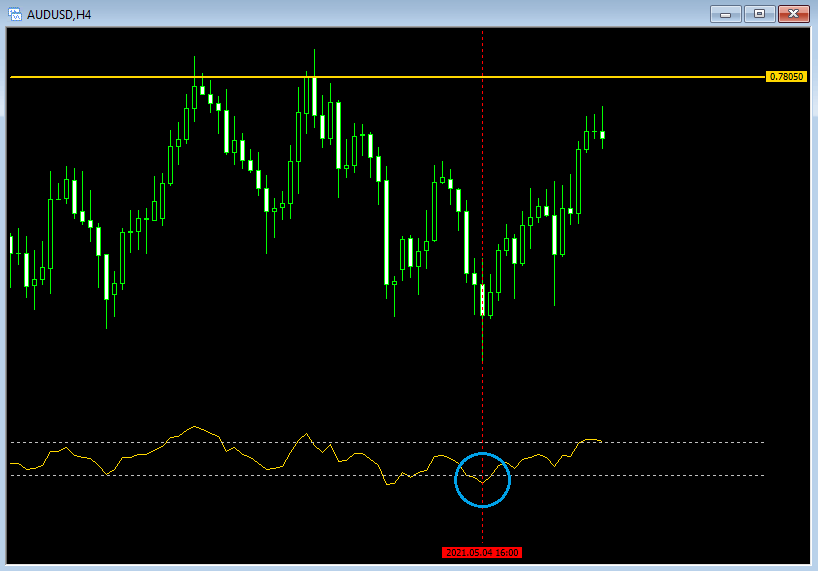
Since the buy signal produced on the signal chart lined up well with the Entry and Trend charts, we can identify this buy entry as a high probability winning trading setup.
The Bottom Line
The use of multiple time frame analysis can significantly improve the odds of making a successful trade. Unfortunately, many traders ignore the usefulness of this technique and stick to a single time frame that they are more comfortable with. Therefore, make it a habit to look at multiple time frames when trading.
If you found this article interesting, let me know by commenting below what you think about this forex multiple time frame analysis.


