
Let’s start off with a question. What is the most commonly used technical indicator in forex trading? Even fundamental analysts use this indicator on daily basis. No need to think too far; the answer is the moving average indicator.
The Moving Average (or simply MA) is probably one of the first forex indicators you learned. You can find it on almost every chart. There isn’t a single trading platform that doesn’t include MA indicators.
In this article, you will learn what is a moving average, types of moving averages, how to choose an MA period, and how to use moving average indicator when trading.
Table of Contents
• Why Use Moving Average Indicator?
• Types of Moving Average Indicators
• How to Use Moving Average
• Using Moving Average as Support and Resistance
• What is the Best Moving Average to Use?
• Conclusion
What are Moving Averages?
A moving average helps you filter out the noise in the market and find the direction of the actual trend. It calculates the average of a set of data points. As the market shifts, the data points change, basically replacing older data with new data.
The closing price of the bar is generally used to calculate the moving average, but you can change this in the settings of the indicator. Other prices, such as the high, low, or weighted value of the bar, are sometimes used.
The average value is calculated using prices over a time. The period is a parameter that can be changed to fit the trader’s needs.
Moving averages can be applied to all types of charts and timeframes.
In the case of an hourly chart, the 10-period moving average calculates the closing price for the last 10 hours (or bars). On the daily chart, the average price for the last 10 days will be calculated.
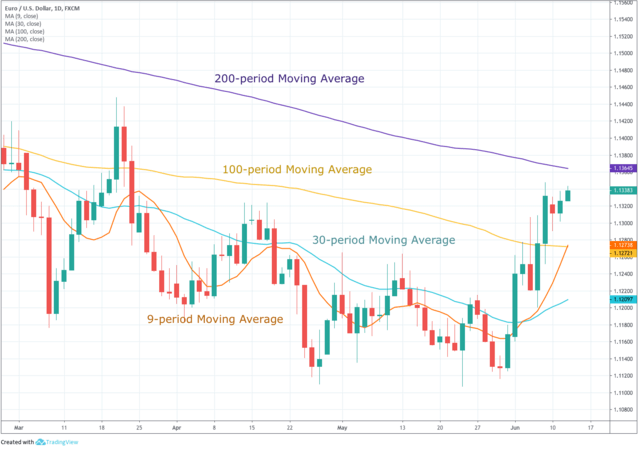
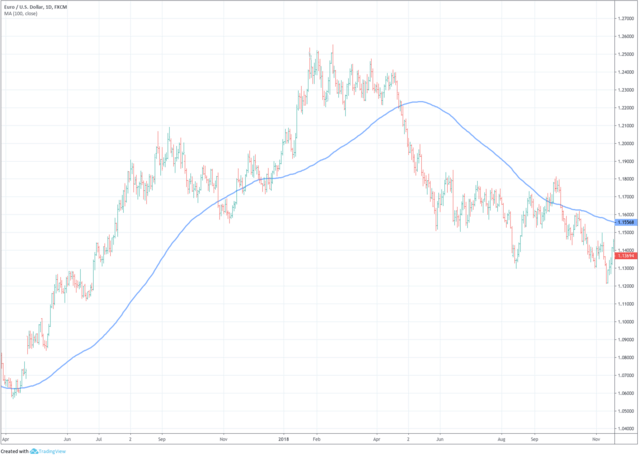
The following chart shows typical moving average periods on the EURUSD daily chart.
Why Use Moving Average?
By looking at the moving average, a trader can figure out how the market is doing right now.
For example, in the chart above, we can see that the price is moving below its 200-day moving average.
This indicates that the pair is in a bearish trend. This bearish trend is also indicated by the downward slope of the MA.
We also see that before the last price reversal, the moving averages were ordered from top to bottom: the 200-day moving average is above the 100-day moving average, which is above the 30-day moving average, and the latter is above the 9-day moving average.
This organized direction is caused by a continuous downward trend. When the trend is up, we see a similar organization of moving averages, but upside down: the 200-day moving average is lower, the 100-day moving average follows it, and so on up to the 9-day moving average.
When the fast moving average (with a period of 9) crosses the slow moving averages (with periods of 100 and 200) from the bottom up, they say that the trend has changed to an uptrend. And vice versa, when the fast moving average crosses the slow moving averages from top to bottom, they say that the trend has changed to a downtrend.
Thus, the moving average indicator helps to determine both the global trend direction and the current state of the market. It can be used both as a filter for opening trades only in line with the trend, or as an independent strategy in combination with moving averages of various periods and other indicators.
Types of Moving Average Indicators
There are different types of moving average indicators, including:
1. Simple Moving Average (SMA)
This is a simple average of prices over a certain period, which is calculated as the sum of the closing prices and then divided by the number of periods.
The main problem with this type of averaging is the lagging of indicator signals. Since the delay can be long, it may be too late when a trader makes a trade, resulting in lost profits and loss of money. Thus, traders began to wonder how to improve the underlying moving average.
The main idea of the following types of moving averages is to give the latest prices a different weight compared to older prices and thus get a more responsive average.
2. Exponential Moving Average (EMA)
For this type of average, importance is given to the last bars, which makes it more flexible for short-term trading. Therefore, traders are more likely to use EMAs for short periods, and SMAs are more suitable for large periods (for example, 200).
Exponential moving averages are made by adding a portion of the current price to the value of the previous EMA. This gives more weight to the most recent prices.
3. Smoothed Moving Average (SMMA)
This type of moving average is something in between a simple and an exponential moving average. This is a smoother average, as the name suggests, which makes it better for finding long-term trends.
So, it is better to set a longer period. At the same time, it is slower than all other types of moving averages and responds less well to price changes, so it is less popular among traders.
4. Linear Weighted Moving Average (LWMA)
It’s like a different version of the exponential moving average. It gives more weight to the latest bars and less weight to the earlier bars. This is a faster moving average and is very dependent on sharp price fluctuations, so it is rarely used by traders.
Of the above, the SMA and EMA are the most commonly used moving average indicators.
How to Use Moving Average
The moving average indicates the direction of the trend of the underlying asset. A rising average indicates an uptrend in the underlying asset, and a falling average indicates a downtrend. Let’s look at how to use them properly.
Using one moving average
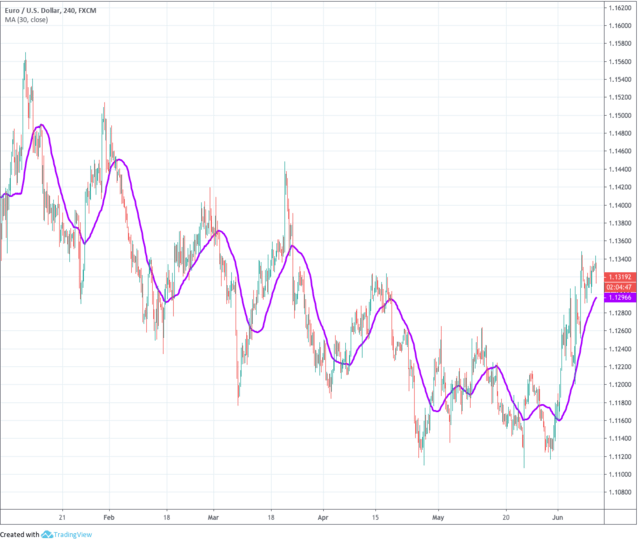
To detect a trend using a single moving average, you need to choose a period equal to half the period of market cycles. Usually a period of 30 bars is adequate. If, as in the case above, this is not the case, this means that the price is moving in a price channel with a shorter period, and you need to reduce the average period or move to a shorter time frame, such as H4 or H1.
There are two ways to determine the trend using a single moving average:
1st way – the intersection of the price and MA. The direction of the trend is determined by the location of the price above or below the moving average. If the price is above the MA, the current trend is bullish, and if the price is below the MA, the trend is bearish. Thus, a price crossover above or below the moving average triggers trading signals or acts as a filter to allow only long or short positions. This system does not recognize lateral movements very well.
2nd way – slope MA. This method is based on determining the trend by the slope of the moving average. If the MA is tilted down, then the trend is down, and if it is up, the trend is up.
Using two moving averages
This method of determining the trend is similar to the first method, but instead of crossing the price and MA, the intersection of two moving averages is used. When a fast moving average with a shorter period crosses the slow moving average from top to bottom, the trend is bearish and only sells are considered. When the fast moving average crosses above the slow moving average, the trend is bullish and only buys are considered.
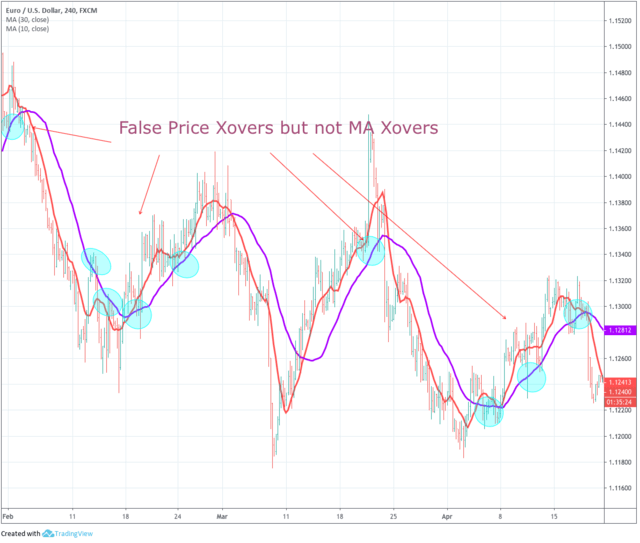
In the figure above, we can see how the price broke through both moving averages, but these breakouts were false (in the figure, false breakouts are marked with blue circles). When using this method, we exclude false penetrations and determine a trend change based on the intersection of two MAs, which gives a more effective option for the outcome of the transaction.
Using three moving averages
There are many strategies using three moving averages. The most common is the use of short-term, medium and long period moving averages. If you take the previous method and add another long-term MA with a period of 100 to it, you will get an excellent strategy, which also filters out sideways trades.
This is how it should be traded. If both fast moving averages are below SMA 100, then we consider only sell signals, while the faster MA should cross the slightly slower one from top to bottom. Conversely, for buying, both moving averages must be above the SMA 100, and the faster one must cross the slower one from the bottom up.
The disadvantage of this strategy is that the SMA 100 slow moving average filter misses potential countertrend profitable trades, but ignores side channel signals.
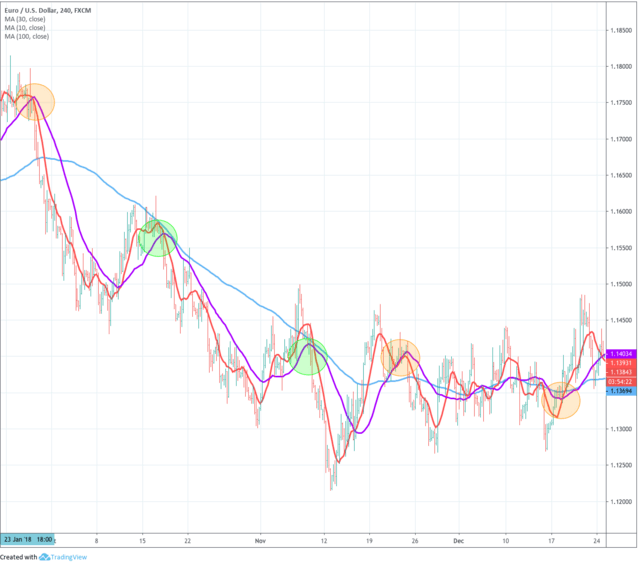
Using Moving Average as Support and Resistance
The moving average indicator can be used as a dynamic support or resistance line, just like trend lines are used for this. The advantage is that they can be easily tested in the strategy tester, unlike straight lines.
The idea is that the price moves in momentum and then returns to its average price. When the price starts moving away from the moving average again, this indicates that the average has not been broken and the current trend is still valid.
As with trendlines, moving averages have false breakouts, as seen in the chart above, but in general, using these price prediction methods pays off the risks.
What is the Best Moving Average to Use?
Most often, traders choose exponential moving averages for scalping and intraday trading, and for large time frames they use a simple moving average. Other types of moving averages are used extremely rarely, so you can forget about them.
In terms of periods, EMAs of 8 and 21 are usually chosen for short periods and SMAs of 100 and 200 for larger timeframes. The longer the period of the Moving Average, the more price momentum is needed to change the direction of the trend.
Conclusion
Moving averages are the easiest and most effective way to determine the direction of a trend. But they also have their drawbacks, such as the delay in the SMA and false breakouts in the EMA. But if you combine them with other Forex indicators, you can create a good trading strategy. There are plenty of MAs to choose from. So make sure that you use the correct moving average indicator that fits your trading strategy.


