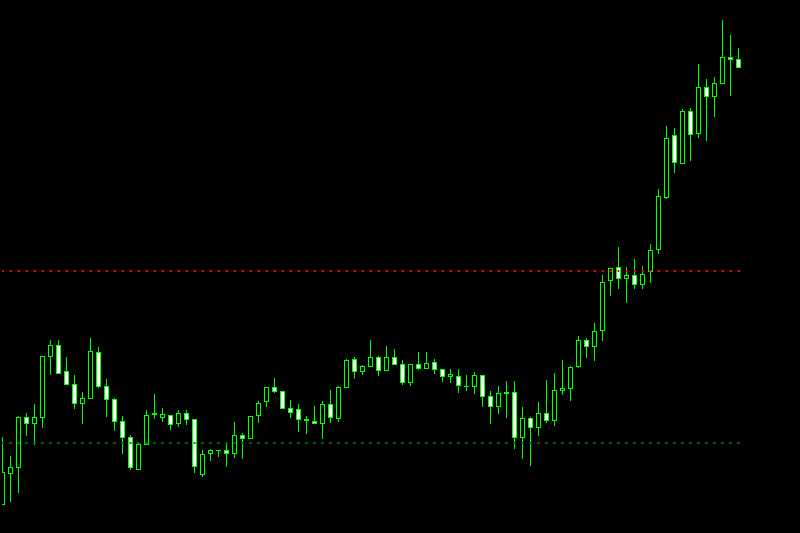
The Support and Resistance Lines Indicator automatically plots the support and resistance lines at different price levels on the chart. The green lines show the resistance level and the red lines show the support level. These horizontal lines on the price chart act as psychological barriers where traders expect price to either pause or change direction. The indicator automates the process of drawing these lines, saving time and reducing the likelihood of human error.
One of the key advantages of the Support and Resistance Lines Indicator is its ability to dynamically adapt to changing market conditions. These lines are not static; they evolve based on recent price data, ensuring that you are working with the most current and relevant information. When price approaches these levels, traders are given a cue to either enter or exit positions. A touch or bounce off a support line often serves as a bullish signal, whereas hitting a resistance line may indicate a bearish trend.
The adaptability of the Support and Resistance Lines Indicator extends to various asset classes and time frames. Whether you’re trading forex, commodities, or equities, these lines serve as universal markers of potential trend shifts. Additionally, they are effective on any time scale, making them useful for day traders scrutinizing short-term price movements as well as long-term investors looking for sustained trends.
Furthermore, the indicator’s settings are generally customizable, allowing you to adjust the sensitivity or look-back periods according to your trading style and risk tolerance. Some versions also incorporate color-coding or varying line thickness to indicate the strength or significance of support and resistance levels, providing an extra layer of analytical depth.
How to use this indicator:
Trade the “Bounce”
– Buy when the price falls towards support.
– Sell when the price rises towards resistance.
Trade the “Break”
– Buy when the price breaks up through resistance.
– Sell when the price breaks down through support.
This is a MetaTrader 5 (MT5) indicator and works with all currency pairs and all timeframes. Once you download and install the indicator, it will appear in your trading chart, like the image shown above.
This Download is for VIP Members Only. Not a VIP Member? Join & Get Instant Access Now.


