Home » Forex Education » 12 Economic Indicators All Forex Traders Need to Watch
12 Economic Indicators All Forex Traders Need to Watch
Have you ever experienced that you were in a good position with a nice profit when the market suddenly became volatile, causing you to lose money?
Have you only traded according to technical analysis and not even looked at the daily economic calendar?
If so, then you should read this post carefully because it can open your eyes in many ways!
How can we learn to trade these economic events? With the help of fundamental analysis.
We all know that fundamental analysis is an essential tool in forex trading. It allows traders to understand why the markets are moving.
Economic data releases are the core of fundamental analysis. With the help of free economic calendars like Forex Factory economic calendar, you can prepare for the most important events every day.
What Are Economic Indicators?
According to Wikipedia, economic indicators are statistics about economic activities. They are regularly published by government agencies and private organizations. They are critical drivers in the financial markets.
The CME group confirmed this in a 2013 study. They found that specific economic indicators significantly affect currency fluctuations and trade direction.
Hundreds of these data points are released each month. There are three types of indicators: leading, lagging and random.
Leading indicators usually signal possible future economic changes. These statistics will often change before an economy does.
Lagging indicators usually have a delayed reaction to changes in an economy.
Random indicators change simultaneously with the economy. It shows the current state of an economy.
Not all economic indicators are equally important. Some are of much greater importance than others.
12 Key Economic Indicators That Can Have a Huge Impact on Forex Trading
1. Monetary Policy Statements (Central Bank Monetary Policy Meetings)
The central bank’s monetary policy statements are one of the most critical indicators. So why are central banks important?
They are responsible for a country’s monetary policy. This means they control the money supply in the economy. The central bank or central bank can therefore take money out of the economy or add it. It can also control the attractiveness of investing and borrowing via the key interest rate, depending on whether the economy is doing well or badly.
Monetary policy can be both restrictive and expansionary.
During tightening policies, interest rates are raised to counter rising inflation. In contrast, an expansionary policy aims to promote economic growth through low interest rates.
Central bankers try to inform the markets about future monetary policy changes. According to the ECB, this is referred to as forward guidance.
The Federal Reserve began using forward guidance in the early 2000s. In Europe, the ECB started using it from July 2013.
The main purpose is to ensure that the markets do not riot unprepared. In a 2014 study, over 74% of central bankers surveyed said transparency was an essential part of monetary policy.
The Importance of Central Bank Statements
Why is transparency so important? Traders can react illogically when there are surprises in the markets.
An example of this was the Swiss central bank’s surprise decision to unpeg the EURCHF pair. The surprise was that the pair fell over 30%, leading to severe market volatility.
The tone used by central bankers is also important. Markets are trying to determine whether policymakers are positive or negative on future interest rates.
Let’s assume that the ECB reveals a negative interest rate outlook at a central bank meeting, then this will devalue the EUR. In June 2018, the ECB surprisingly did so and EURUSD fell 240 pips in the next few hours.
When central bankers argue for higher interest rates, they are referred to as “hawks”. When they demand lower interest rates, they are referred to as “Doves”.
“Hawkish” statements usually cause currency appreciation. But when monetary policy is dovish, currency devaluation occurs.
2. Interest Rates
Interest rates, and interest rates in particular, are a big deal and every trader should understand how interest rates affect the stock, bond, forex, and commodity markets. Interest rate adjustments are one of the most important economic indicators that impact forex trading.
Interest rate changes can have a huge impact on currencies.
Investors are always looking for a better return on their investments. When a country raises interest rates, it attracts foreign investment. Especially the big pension funds, which manage several billions and are not allowed to invest everything in the stock market.
When interest rates are low, this usually leads to an increase in economic growth. As the economy expands, it should generate capital inflows into the local currency.
This means that the timing of the interest rate change is crucial.
When rates rise early in an economic cycle, it’s positive for the currency. Rate hikes late in an economic cycle do not have the same effect.
3. Consumer Price Index (CPI)
According to Investopedia, the CPI is commonly used to measure inflation.
The CPI tracks the price change of a basket between two periods. A CPI YY (= year on year) of 2% means that prices have increased by 2% compared to the previous year.
The basket measured in the CPI includes a wide range of goods and services. This includes things like food, clothing, transportation, education, energy, healthcare and housing.
The CPI is considered as a lagging indicator. But that doesn’t mean it’s less important!
Price stability is a common mandate of most central banks. Most of them also have specific targets for inflation. An inflation rate of 2% is considered the ideal target for industrialized countries.
Inflation is one of the most important metrics for monetary policy decisions. Interest rates are the most common tool central banks use to control inflation.
When inflation is too high, central banks typically raise interest rates. When inflation falls too far below their target, they typically lower interest rates.
We know that currencies fluctuate with interest rate expectations. Due to the inflation targets, the publication of the CPI can lead to large movements in the markets.
Below is a recent example of the impact that CPI releases can have.
GBPCAD (representing other GBP pairs) fell c.100p in the first hour after the release of missed inflation data. and amplified the downtrend.
As inflation rises, so do expectations of interest rates. The opposite happens with weak inflation well below 2%.
This makes inflation one of the most influential indicators for traders.
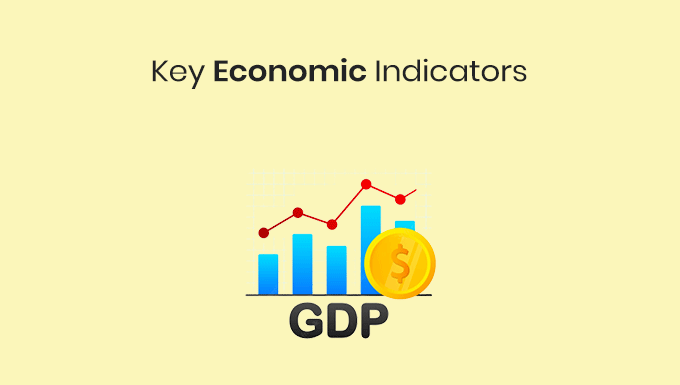
4. Gross Domestic Product (GDP)
Gross domestic product is the total value of all goods and services produced within an economy.
According to Focus Economics, it is the most widely used measure of economic activity.
Some consider GDP to be a lagging indicator. Others classify GDP as a random indicator.
According to Reuters, the delay in some GDP components does not diminish its importance or impact on the markets. The CME Group explains that GDP releases can cause fluctuations in the markets.
They go on to explain that GDP is “the scorecard of a country’s economic performance.” As a pro-cyclical indicator, GDP moves in the same direction as the economy.
That means if the economy is doing well, it should grow. If the economy slows down, it should slow down.
The most common way to measure GDP is the rate of change as a percentage. A GDP QQ growth rate of 3% means an economy has grown 3% quarter over quarter.
In addition to inflation, the central banks pay more attention to the growth rate of an economy.
Too little growth could require a more expansionary policy. If growth is too high, restrictive policies (rising interest rates) may be required.
Growth figures can be another important criterion for future monetary policy.
5. Employment Trends & Unemployment Rate
There are two employment indicators that are very important. The first is the unemployment rate and the second is the change in employment.
Governments typically track changes in employment on a monthly basis. Some central banks track changes only once a quarter.
It measures the total number of workers added to an economy.
The unemployment rate is the percentage of unemployed workers in an economy. As a rule, the unemployment rate is published together with the changes in employment.
Employment indicators are considered as lagging indicators. They usually take longer to show the impact of changes in an economy.
Employment figures can be very volatile. The US Non-Farm Payrolls (NFP) are the perfect example of this.
NFP measures the total number of employees in US companies. This number excludes workers such as government employees, farm workers, and NGO workers.
According to the experts, the NFP is the most volatile of all economic indicators. They explain that the NFP can drastically affect volume, volatility and price direction. It is mainly the USD that moves when the data is released, but we also regularly see swings in gold and the stock markets.
Why are these events so volatile? Central banks attach great importance to employment figures.
Employment is also part of the mandate of many central banks. These include the ECB, the Federal Reserve, RBNZ and the RBA.
These monthly reports are important events to keep track of every month.
6. Average Earnings
Median income is the change in wage growth in an economy.
Why is wage growth so important? It’s because of the impact wages can have on growth and inflation expectations.
A key driver of growth in the developed economies is consumer spending. When people make more money, they can spend more and invest more.
An interesting point is the impact of average earnings on wage inflation. Many economists believe that wages lead to inflationary pressures.
Both the ECB and the RBA see wage increases as a necessary cause of higher core inflation.
According to a Riksbank study, this is not the case. They found no empirical evidence that wage growth led to inflationary pressures.
So why should we focus on average earnings? The reason for this is the expectations.
The only thing that matters in trading is knowing how the market sees or anticipates things. If central banks focus on raising wages, so should we.
This can give us great trading opportunities. If wage growth rises or falls, it will have a direct impact on inflation expectations.
In February 2018, global stock markets fell more than 10% in a matter of days. A surprise rise in average wages raised fears of higher future interest rates. In the forex market, the affected currencies rose accordingly.
This can give us great trading opportunities. Especially if wage changes affect the policy stance of central bankers.
7. Purchasing Managers Index (PMI)
The Purchasing Managers Index (PMI) is an important leading indicator. The PMI is a survey compiled from questionnaires sent to hundreds of purchasing managers.
Purchasing managers evaluate the business situation in their respective sectors. They are asked to comment on employment, inventories, production and order intake.
Don’t underestimate PMIs, even if they’re just surveys. Companies are the first to react to changing conditions.
When companies start worrying about an economy, it shows up in the PMI’s. The PMI’s can provide a leading indicator of economic activity.
Manufacturing and service PMI’s are the most important. Manufacturing and construction no longer have quite as much impact on growth in our digitized world and are therefore not as relevant to the market.
There are two things we need to keep in mind when evaluating PMI data:
PMI releases must be evaluated in line with the business cycle of the economy.
When an economy is in an expansion cycle, a high PMI reading might not mean much. This is that expansionary cycles tend to have higher PMI numbers.
PMI data that deviate from current cycle expectations are important.
The 50’s level is crucial for PMI data. A reading above 50 indicates expansion and below 50 indicates contraction.
Below is an example from 2/5/19 in GBP that PMI releases can have decent intraday moves in markets.
8. Retail Sales
Retail sales is a measure of all retail sales in a given period. It is considered a leading indicator.
Retail tracks the rate of change in sales as a percentage. Retails Sales YY of 3% means retail sales are up 3% year over year.
Why are retail sales an important indicator? The answer comes down to consumption. According to the World Bank, around 60% of total GDP comes from consumption. However, the numbers vary from country to country.
In the US, consumer spending accounts for about 70% of GDP. In the EU, it accounts for only about 57%.
Retail can show us when the economic environment is changing. It tells us when interest rates or inflation are too high or too low.
When interest rates rise, people pay more on their mortgages and debt. This affects their disposable income.
When inflation rises, the consumer can buy fewer things for the same income. This also applies to disposable income.
If consumers start spending less, we can expect economic growth to slow down.
9. Confidence and Sentiment Indicators
There are many indicators of consumer and business confidence and sentiment. There are different indicators for different countries:
Business climate index (compiled by the OECD for most countries)
Consumer Confidence Index (created by the OECD for most countries)
Consumer Confidence Survey (Created by the Conference Board for the USA)
Consumer survey (compiled by the University of Michigan for the US)
New economic assessment & framework conditions (collected by Zew financial market studies for Germany and the EU)
IFO Business Climate Index (compiled by the IFO Group for Germany)
ANZ Business Outlook (created by ANZ Investment Bank for New Zealand)
Westpac Consumer Sentiment (compiled by Westpac Investment Bank for Australia)
The surveys serve as a mood barometer. Consumers and companies are asked about their future economic expectations. Confidence and sentiment are key leading indicators. Sentiment is a key driver of an economy.
These indicators are useful for estimating possible changes in the business cycle. Higher interest rates and inflation in an economic peak should be reflected in sentiment.
Therefore, significant deviations in sentiment indicators can provide excellent trading opportunities.
10. Stock Markets
The stock market is considered one of the most important early indicators. Stock markets usually start to rise before an economic recovery. They also begin to decline before an economy enters recession.
However, the fluctuations on the stock markets are not always in line with the economy. There are regular exaggerations in terms of price development.
Stocks are very useful for traders as an indicator of risk sentiment. When news or events create uncertainty, many investors become nervous and reallocate capital.
This causes them to move their capital away from risky assets in favor of safe assets. This is known as risk-off sentiment.
When news or events lead to optimism in the markets, traders want to take on more risk. That means they move capital away from safety and into riskier assets. This is then referred to as risk-on sentiment.
Stocks are considered risky assets. Stocks are one of the first asset classes to respond to risk.
The following is an overview of common safe-haven assets in demand for risk-off sentiment:
The Japanese Yen and the Swiss Franc
Government bonds from developed economies
gold
And in turn, here are the most common assets that rise during risk-on markets:
Stock markets (mostly global stocks)
High beta currencies like AUD, NZD and CAD
commodities like oil
Reactions in global equities can precede moves in risk-correlated currencies. This makes the stock markets an important indicator for forex traders.
11. Commitment of Traders Data (COT)
The CFTC report shows overall futures contract positioning. It contains data for a variety of markets.
The report is released every Friday by the Commodity Futures Trading Commission (CFTC). The report covers futures positions for three different market participants.
Non-commercial traders (hedge funds, professional traders)
It is important to note that CFTC data released on a Friday only includes data from the previous Tuesday. That means the data has a three day lag!
The main advantage of the report is to see the net positioning. This means you need to see when there are net short or net long positions on currencies.
When markets build record net positions on a currency, we have to be careful. Extreme net short or long positions typically do not last long.
Eventually, extreme positions will either reverse or take a breather. This gives traders a market edge.
12. Commodity Prices
What do commodities have to do with forex trading? Commodity data can have volatile impact on currencies.
Certain countries are major producers of certain commodities. As a result, fluctuating commodity prices may affect certain economies.
Let’s take oil as an example. If a country is a major oil producer, its economy will be affected by oil prices.
This also applies to other raw materials. Canada is a major oil producer. When the price of oil fluctuates, it affects the Canadian economy.
So when we discover news about the oil market and see a reaction in WTI, Brent, etc., this often influences the development in CAD as well.
Conclusion
These may be 12 of the highest impact economic indicators, but there are literally hundreds each month released by all global economies that can affect foreign exchange rates. The impact of these economic indicators can be immediate, like a sudden change in the exchange rate can quickly change the outcome of a trade.
For us as macro FX strategy traders, every day is about identifying strong and weak currencies. Since we now know the economic indicators mentioned inside out, it is easy for us to form corresponding FX pairs when they are released.
This website uses cookies to ensure you get the best experience on our website. Learn moreAccept
Manage consent
Privacy Overview
This website uses cookies to improve your experience while you navigate through the website. Out of these, the cookies that are categorized as necessary are stored on your browser as they are essential for the working of basic functionalities of the website. We also use third-party cookies that help us analyze and understand how you use this website. These cookies will be stored in your browser only with your consent. You also have the option to opt-out of these cookies. But opting out of some of these cookies may affect your browsing experience.
Necessary cookies are absolutely essential for the website to function properly. These cookies ensure basic functionalities and security features of the website, anonymously.
Cookie
Duration
Description
cookielawinfo-checbox-analytics
11 months
This cookie is set by GDPR Cookie Consent plugin. The cookie is used to store the user consent for the cookies in the category "Analytics".
cookielawinfo-checbox-functional
11 months
The cookie is set by GDPR cookie consent to record the user consent for the cookies in the category "Functional".
cookielawinfo-checbox-others
11 months
This cookie is set by GDPR Cookie Consent plugin. The cookie is used to store the user consent for the cookies in the category "Other.
cookielawinfo-checkbox-necessary
11 months
This cookie is set by GDPR Cookie Consent plugin. The cookies is used to store the user consent for the cookies in the category "Necessary".
cookielawinfo-checkbox-performance
11 months
This cookie is set by GDPR Cookie Consent plugin. The cookie is used to store the user consent for the cookies in the category "Performance".
viewed_cookie_policy
11 months
The cookie is set by the GDPR Cookie Consent plugin and is used to store whether or not user has consented to the use of cookies. It does not store any personal data.
Functional cookies help to perform certain functionalities like sharing the content of the website on social media platforms, collect feedbacks, and other third-party features.
Performance cookies are used to understand and analyze the key performance indexes of the website which helps in delivering a better user experience for the visitors.
Analytical cookies are used to understand how visitors interact with the website. These cookies help provide information on metrics the number of visitors, bounce rate, traffic source, etc.
Advertisement cookies are used to provide visitors with relevant ads and marketing campaigns. These cookies track visitors across websites and collect information to provide customized ads.