
Knowing how to draw support and resistance lines correctly is one of the essential tools in technical analysis that every trader should master. These key levels, formed through historical price actions, offer insights into potential price reversals and continuations. It helps traders figure out how prices might respond and how they might move in the future. In this article, I’m going to show you how to find support and resistance levels in Forex, giving you with knowledge that can significantly improve your trading strategies.
Table of Contents
• How to Identify Support and Resistance Levels
• How to Draw Support and Resistance Lines
• Importance of Multiple Time Frame Analysis
• Factors That Strengthen a Support or Resistance Level
• Role of Psychological Levels in Support and Resistance
• Why Are Support and Resistance Important?
• Mistakes to Avoid When Drawing Support and Resistance
• Conclusion
• FAQs
Understanding the Basics of Support and Resistance
What Are Support and Resistance?
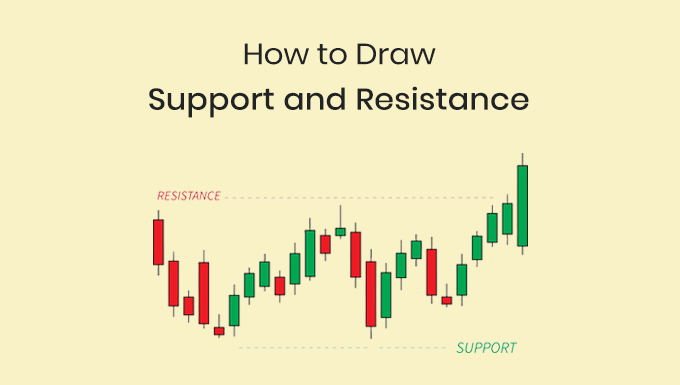
Support: Picture a ball bouncing on the ground. The ground prevents the ball from going any further down. In forex, the “ground” is the support. It represents a price level or zone where a currency pair tends to stop falling, primarily due to an increased amount of buying interest. In essence, support is the price level at which demand (buying power) is strong enough to prevent the price from declining further!
Resistance: Now, think of the ball’s upward motion being halted by a ceiling. That “ceiling” in forex terms is the resistance. It signifies a price level or zone where selling interest overcomes buying pressure, causing the price to turn back down. In short, resistance is where the price usually tops and starts to decrease.
Understanding these levels is important for traders as they indicate potential reversal or continuation of trends. When prices break through these levels, it’s an indication of a potential stronger move in the direction of the breakout.
However, not all support and resistance levels are created equal. Their reliability can vary, and understanding the factors that contribute to strong support and resistance is crucial for successful trading.
How to Identify Support and Resistance Levels
Support and resistance levels are identified by studying historical market data, mainly price and volume.
To find support and resistance levels, there are a few different methods. You can easily find these levels, and they can help you decide when to enter a market and where to put your stops and limits. Traders can use following ways to identify support and resistance levels:
1. Historical price data
Historical prices are the most accurate way to find levels of support and resistance, which makes them very useful for traders. Start by looking at historical data and pinpoint areas where the price has repeatedly reversed or consolidated. These are your primary clues. Typically, the more times a price tests a support or resistance level without breaking it, the stronger that level is considered.
Tip: Look for price levels where the market has reversed multiple times. These are your primary support and resistance zones.
Forex charts are traders’ best friends. Using tools like horizontal lines or rectangles can help in visually identifying and marking these zones. Remember, support and resistance are not always exact numbers. They can be zones or ranges where the price has shown significant activity.
The more visible a support or resistance level is, the more useful it tends to be for future reference. Hence, those that appear on daily or weekly charts are usually more reliable than those found on hourly charts.
2. Previous support and resistance levels
You can use key support or resistance levels from the past to find entry and exit points and to predict how prices will move in the future. It is important to keep in mind that major levels of support and resistance are not always exact numbers. It doesn’t happen often that the market touches the same price over and over again before reversing, so it’s better to think of them as support or resistance zones.
Tip: Using line charts instead of candlestick or bar charts can sometimes make it easier to see the closing prices, which are vital when drawing these lines.
3. Technical indicators
Technical indicators or trend lines can show levels of support or resistance that change as the price moves. Levels of support and resistance are often determined by various factors. Because of this, it can take some time to learn how to draw support and resistance levels that will have an effect on a market’s price. That’s why it’s important to use past charts to practice finding levels of support or resistance.
Tip: Always remember that these levels are zones, not exact numbers. It’s okay if the price goes a few pips above or below your line before reversing.
How to Draw Support and Resistance Lines
You could use one of the following ways to find support and resistance lines on a chart before you can draw them.
Drawing Horizontal Lines
One of the simplest ways to mark support and resistance is by drawing horizontal lines on your chart:
- For support: Spot where the price dips and then bounces back. Draw a horizontal line at this level.
- For resistance: Find where the price peaks and starts to drop. This is your cue to draw a horizontal line.
Tip: Adjust your lines. Initially, you might place a line at a high or low. However, as more data becomes available, it might become clear that a mid-candle level is more relevant. Be flexible and adjust as needed.
Using Trendlines
Not all support and resistance lines are horizontal. Sometimes, prices move in a diagonal trend. Make sure there are at least three peaks or dips before you draw your lines on a trend line so that it can be used. Next, draw the trendlines on your chart. The rising line will be the level of support, and the downward trend line will be the level of resistance. These levels change over time, just like moving average support and resistance levels.
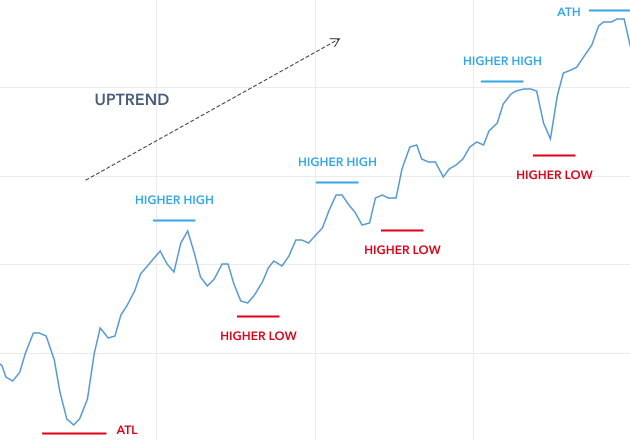
Tip: Connect the lowest lows in an uptrend or the highest highs in a downtrend using a straight line.
Technical Indicators
Different indicators can improve the accuracy of support and resistance levels. Some popular choices include:
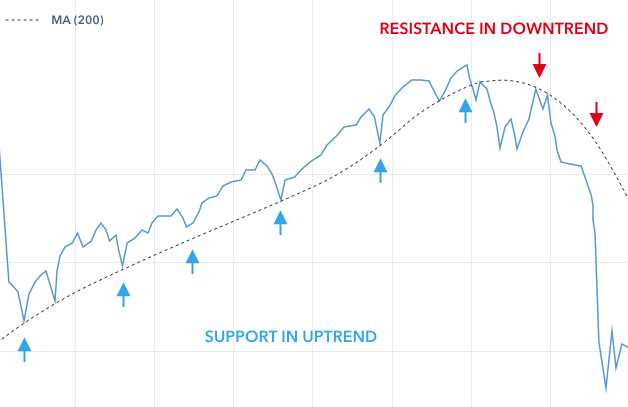
- Moving averages: These can act as dynamic support or resistance, especially the 50-day and 200-day moving averages.
- Fibonacci retracements: Based on the Fibonacci sequence, these levels can predict potential support and resistance zones.
- Volume profile: This reveals at what prices the most trading activity happened, marking vital levels.
Importance of Multiple Time Frame Analysis
Incorporating multiple time frame analysis can greatly enhance the accuracy of your support and resistance identifications.
By looking at a currency pair on multiple time frames, you can get a clearer picture of its overall trend. For example, while the hourly chart might show a currency in a downtrend, the daily chart might reveal it’s still in an overarching uptrend.
Tip: The longer the time frame, the more significant the support and resistance levels become.
Identifying support and resistance on larger time frames like daily or weekly charts gives a more significant overview. For example, a resistance level on a weekly chart is more accurate than one on a 15-minute chart. However, fine-tuning your entries and exits on smaller time frames, once those levels are identified, can increase precision.
In essence, larger time frames provide the context or the “big picture”, while smaller time frames offer detailed insights, allowing traders to make informed decisions.
Factors That Strengthen a Support or Resistance Level
Certain factors can amplify the strength of a support or resistance level, making them more reliable in the eyes of traders.
Volume is one such indicator. If a price reversal at a particular level is accompanied by high volume, it suggests that many traders are paying attention to that level, and it might act as a strong barrier in the future.
Tip: Another factor is the number of touches. As mentioned, the more times a level is tested and holds, the stronger it is perceived to be. A support or resistance level that has been tested multiple times but never broken can be deemed more significant than one that has been formed recently.
Lastly, the age of the level matters. Older levels, especially those respected over years, carry more weight than relatively new ones.
Role of Psychological Levels in Support and Resistance
Psychological levels play a fascinating role in Forex trading.
These are typically round numbers, like 1.1000, 1.2000, or 1.3000 in Forex. Traders often set stop orders or take profit levels at these round numbers, making them self-fulfilling as support or resistance levels.
Humans naturally gravitate towards simplicity, and round numbers provide just that. When many traders place their orders around these numbers, they become hotspots of trading activity.
However, one must remember that while these levels do play a role, they should not be the sole basis for making trading decisions. It’s always essential to consider them in conjunction with other factors and indicators.
Why Are Support and Resistance Important?
These levels help traders understand potential entry and exit points, stop-loss placements, and anticipate future price movements. Here are several reasons why support and resistance are important:
- Predictive power: These levels can help traders make predictions about future price movements. For example, if a currency pair approaches a major resistance level and fails to break through it, traders might take that as a sign that the current uptrend is about to reverse.
- Risk management: Recognizing these levels allows traders to set stop-loss orders around them, minimizing potential losses. If a trader believes a price will not fall below a certain support level, they might place a stop-loss order just below it.
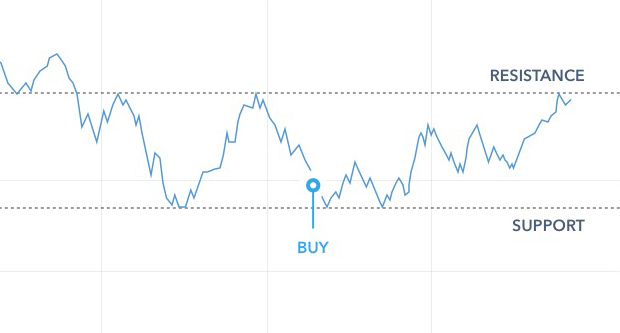
- Entry & exit points: Traders can use support and resistance levels to identify potential entry and exit points. For instance, if a price approaches a resistance level and shows signs of reversing, it might be an ideal exit point for a long position or an entry for a short position.
- Supply and Demand: Support and resistance levels can be visual representations of supply and demand at specific price levels. A resistance level indicates a point where selling interest exceeds buying pressure, preventing the price from rising further. Conversely, a support level is where buying interest outdoes selling pressure, preventing the price from falling further.
- Enhancing Trading Strategies: Many trading strategies, such as range-bound trading, rely on recognizing and capitalizing on support and resistance levels. Traders might buy at support and sell at resistance when they believe the asset will stay within these bounds.
- Confluence with Other Indicators: Combining support and resistance levels with other technical indicators can increase the robustness of a trading decision. For example, if a Fibonacci retracement level aligns with a historical support or resistance level, it can offer stronger evidence of potential price reversal or continuation at that level.
Mistakes to Avoid When Drawing Support and Resistance
While drawing support and resistance, traders can often make some common mistakes.
- Too many lines: One common mistake is drawing too many lines. Chart overload can make it hard to make trade decisions because it can stop you from analyzing the data.
- Ignoring recent data: Another is relying solely on historical levels and ignoring recent price action. While old levels are essential, recent market behavior should never be overlooked.
- Over-reliance: Over-reliance on just one method or tool is another drawback. Whether it’s Fibonacci retracement, pivot points, or trend lines, it’s essential to use a combination of tools and techniques to get a holistic view.
- Confirmation bias: Confirmation bias can be a trader’s downfall. Just because you’ve drawn a line doesn’t mean the price will respect it. Always be prepared for the unexpected and adjust your strategies accordingly.
- Too many indicators: Using too many indicators such as auto trend line indicator can overload the chart with a lot of trend lines. This can confuse traders about what trend lines to rely on.
Conclusion
Support and resistance are the most essential components of technical analysis that help traders predict how prices might move. When identified and applied correctly, these key SR levels can greatly improve a trader’s accuracy and ability to make decisions. These levels provide invaluable insights, guiding decisions on entry, exit, stop loss, and take profit points. To be effective, they must be used along with other technical and fundamental analysis techniques. As with any tool, it takes practice and experience to learn how to draw support and resistance and interpret these levels. By understanding and effectively using support and resistance, traders can significantly improve their success in the forex market.
FAQs
1. What tools can assist me in drawing support and resistance levels?
There are several charting tools and software available to traders that aid in drawing and visualizing support and resistance levels. Popular tools include horizontal lines, trendlines, and Fibonacci retracement tools.
2. How often should I re-evaluate and adjust my support and resistance lines?
It’s crucial to regularly review and adjust support and resistance lines, especially after significant market events or when new data emerges. As the Forex market is dynamic, periodic reassessment ensures your analysis remains relevant.
3. Are support and resistance levels more reliable on specific timeframes?
While support and resistance levels can be identified on any timeframe, those found on longer timeframes like daily or weekly charts tend to be more reliable. However, it’s beneficial to cross-reference across multiple timeframes for a holistic view.
4. How do news events impact established support and resistance levels?
Major news events can lead to increased volatility in the Forex market. While well-established support and resistance levels might hold, there’s always a chance of unexpected breakouts or breakdowns during high-impact news releases.
5. Can I combine support and resistance analysis with other trading strategies?
Absolutely! Many traders integrate support and resistance analysis with other trading strategies and indicators, such as moving averages, RSI, or MACD, to reinforce their trading decisions and enhance their overall strategy.


