Mastering how to use Fibonacci retracement levels can help you improve your trading skills. Fibonacci retracement levels are one of the most widely used tools in technical analysis to identify key levels of support and resistance. These levels are based on the Fibonacci sequence, a mathematical formula that can be applied to a wide range of data, including price charts.
In this article, we will discuss how Fibonacci retracement levels can be used to identify potential entry and exit points in trading, including a step-by-step guide on how to apply this tool in practice.
What is Fibonacci Retracement?
Fibonacci retracement is a technical analysis tool used to identify potential levels of support and resistance in financial markets. This tool is based on the Fibonacci sequence, a mathematical formula that can be used to find ratios and patterns in data.
What is the Fibonacci Sequence?
The Fibonacci sequence was founded by an Italian mathematician called Leonardo of Pisa, also known as Leonardo Fibonacci. The Fibonacci sequence is a series of numbers where each number in the Fibonacci sequence is equal to the sum of the previous two numbers.
The sequence starts with 0 and 1, and the next number is always the sum of the previous two (0, 1, 1, 2, 3, 5, 8, 13, 21, 34, 55, 89, 144, 233, and so on).
If you divide the nearest numbers with each other, for example, 34 /55, 55/89, 89/144 and so on, we get the Fibonacci ratio, which is always 0.618, also known as the Golden Ratio. By dividing other numbers from the Fibonacci sequence, other coefficients can be obtained, for example, 13/34 = 21/55 = 34/89 = 0.382, etc.
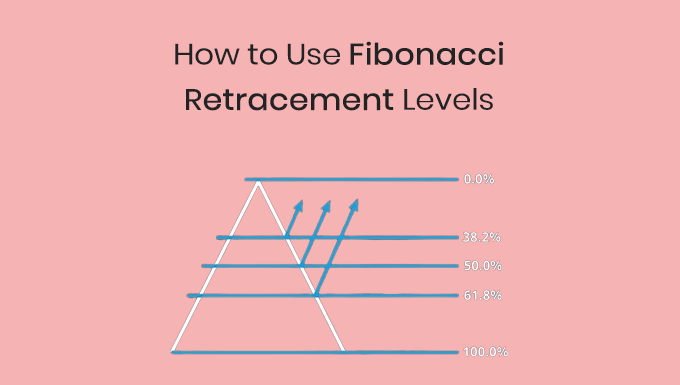
Fibonacci ratios, expressed as a percentage, are often used in trading to find key support and resistance levels. The strongest ratios are 61.8%, 50% and 38.2%. They are also used to assess when a correction stops and a trend resumes.
How to Use Fibonacci Retracement Levels
To use Fibonacci retracement levels, you first need to identify a trend in the currency pair you are trading. Once you have identified a trend, you can use Fibonacci retracement levels to identify potential levels of support and resistance.
Step-by-step Guide on How to Use Fibonacci Retracement Levels
Step 1: Identify the Trend
The first step in using Fibonacci retracement levels is to identify the trend in the currency pair you are trading. This can be done by analyzing price charts and looking for higher highs and higher lows in an uptrend or lower highs and lower lows in a downtrend.
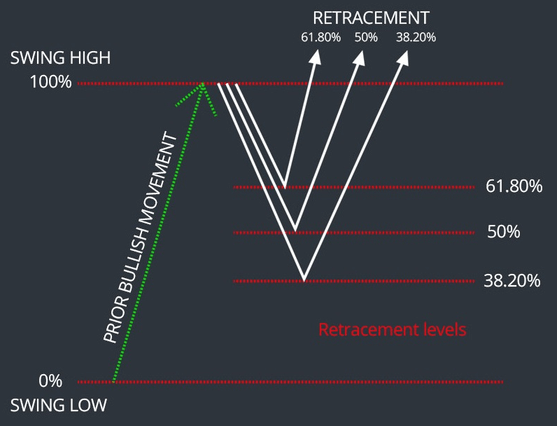
Step 2: Determine the Swing High and Swing Low
Once you have identified the trend, you need to determine the swing high and swing low. The swing high is the highest point in an uptrend, while the swing low is the lowest point in a downtrend.
Step 3: Apply Fibonacci Retracement Levels
To apply Fibonacci retracement levels, you need to draw a horizontal line at the swing high and a horizontal line at the swing low. Then, use the Fibonacci tool to automatically draw the horizontal lines at the 23.6%, 38.2%, 61.8%, and 50% levels, which are the key Fibonacci retracement ratios.
Step 4: Identify Potential Entry and Exit Points
Once you have applied Fibonacci retracement levels, you can use them to identify potential entry and exit points in trading. For example, if the price of the financial instrument bounces back from the 38.2% retracement level, this could be a potential entry point for a long position.
On the other hand, if the price of the financial instrument breaks through the 61.8% retracement level, this could be a potential exit point for a long position.
Example of Using Fibonacci Retracement Levels
Let’s take a look at an example of how to use Fibonacci retracement levels in forex trading.
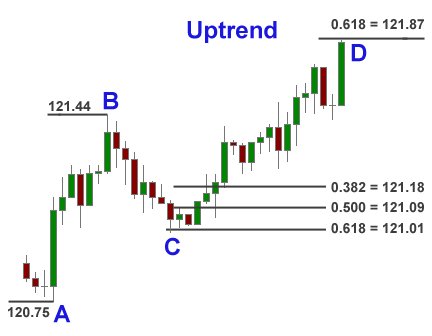
First, we need to identify a trend in the market. In this case, we can see that the market is in an uptrend.
Next, we need to find the high and low points of the trend. Here, the lowest point A is 120.75 and the highest point B is 121.44.
Once we have the high and low points, we can draw the Fibonacci retracement levels on our chart. The levels will be displayed as horizontal lines that indicate potential areas of support and resistance.
In this example, we can see that the market retraced to the 61.8% level before continuing its uptrend. This level provided a potential area of support for traders to enter long positions.
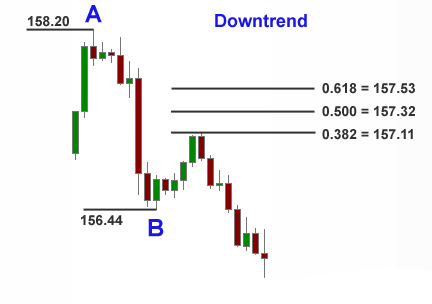
Below is another example in a downtrend market where the market retraced to the 38.2% level before continuing its downtrend.
Fibonacci Retracement Indicators
Traders can add Fibonacci retracement indicators into trading charts to automatically plot the key levels to identify potential levels of support and resistance in a market. These indicators are based on the Fibonacci sequence, and traders can use these levels as potential entry and exit points for trades, as well as to set stop loss orders and take profit targets.
Here are some useful Fibonacci retracement indicators you can download and use:
Pros and Cons of Using Fibonacci Retracement Levels
Like any technical analysis tool, Fibonacci retracement levels have both advantages and disadvantages.
Here are some of the key pros and cons of using this tool:
Advantages of Using Fibonacci Retracement Levels
- Fibonacci retracement levels are easy to apply and understand.
- They can be used in a wide range of financial instruments and timeframes.
- They can be used to identify potential levels of support and resistance.
Disadvantages of Using Fibonacci Retracement Levels
- Fibonacci retracement levels are based on historical data and may not always be accurate.
- They can be subjective and rely on the trader’s interpretation of price charts.
- They may not work in all market conditions, such as during periods of high volatility or low liquidity.
Tips for Using Fibonacci Retracement Levels
Here are some tips to help you use Fibonacci retracement levels effectively in your trading:
- Use Fibonacci retracement levels in conjunction with other technical analysis tools, such as moving averages or trend lines.
- Look for confirmation of support or resistance levels before making a trade. This can be done by analyzing price action, volume, or other indicators.
- Be aware of potential market-moving events, such as earnings reports or central bank announcements, that could affect the price of the financial instrument you are trading.
- Consider using multiple timeframes to analyze the trend and identify potential levels of support and resistance.
Conclusion
Fibonacci retracement levels are a powerful tool that can help traders identify potential levels of support and resistance in financial markets. By following the steps outlined in this article, you can learn how to use Fibonacci retracement levels to identify potential entry and exit points in your trading.
Remember that Fibonacci retracement levels are just one tool in a trader’s toolkit and should be used in conjunction with other technical analysis tools and market knowledge. With practice and experience, you can develop your own trading strategy using Fibonacci retracement levels and other tools to help you succeed in the markets.
FAQs
Q: What is the difference between Fibonacci retracement and Fibonacci extension levels?
A: Fibonacci retracement levels are used to identify potential levels of support and resistance in a trend, while Fibonacci extension levels are used to identify potential levels of profit taking or exit points in a trend.
Q: Can Fibonacci retracement levels be used in any financial instrument?
A: Yes, Fibonacci retracement levels can be used in a wide range of financial instruments, including stocks, forex, commodities, and cryptocurrencies.
Q: How accurate are Fibonacci retracement levels?
A: Fibonacci retracement levels are based on historical data and may not always be accurate. They should be used in conjunction with other technical analysis tools and market knowledge.
Q: Can Fibonacci retracement levels be used in short-term trading?
A: Yes, Fibonacci retracement levels can be used in short-term trading, but they may be less reliable in choppy or volatile markets.
Q: Do professional traders use Fibonacci retracement levels?
A: Yes, many professional traders use Fibonacci retracement levels as part of their technical analysis toolkit.


