
Many traders use Japanese candlesticks as part of their technical analysis to study forex trading charts.
Learning how to read Japanese candlesticks is important if you want to know how the candles on a chart interact with each other and provide a basic understanding of how the market works.
In this article, I’m going to explain what Japanese candles are, their structure, and how to read them when trading forex.
History of Japanese Candlesticks
Japanese candlesticks appeared in the 17th century, thanks to Japanese rice traders at the very beginning of the stock market trading.
Back then, there were no computers, and all the price changes were hand-drawn.
In Europe, Japanese candlesticks appeared much later, only in the 90s of the last century, by the efforts of a trader and analyst Steve Nison. Although the books of Steve Nison were written more than 20 years ago, they do not lose their relevance until now and are recommended for novice traders to read and learn.
Japanese Candlesticks Charts
There are three ways to display the price on the chart in the trading terminal:
- Line chart
- Bar chart
- Candle chart
A trading chart consisting of Japanese candlesticks has advantages over the bars and line charts.
It shows the closing price at a certain point in time, the opening price, and the maximum and the minimum price.
The picture below shows three types of price charts (from left to right – line chart, bar, and candle).
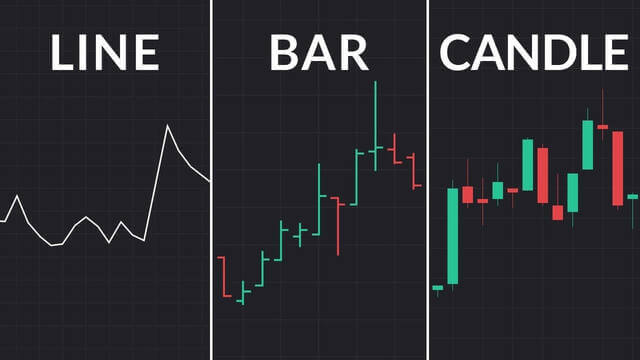
The line chart is the most visible, but its main drawback is that it is not informative enough.
For example, if you choose a line chart on a daily timeframe, the line will only connect the day’s closing prices, while the price may change very much inside the day, and the information that the line chart gives us may not be enough to trade according to your strategy.
As opposed to line charts, Bars are more informative, but Japanese candles are considered the most visual and convenient for novice traders, so I recommend working with candle charts.
What Does a Japanese Candlestick Meaning?
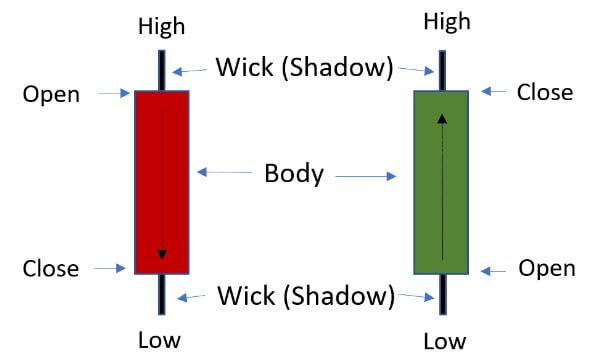
Below is the structure of the Japanese candle.
As you may have noticed, Japanese candles are bullish – candles growing up, and “bear” – candles falling down. The color of the candles can be different. You can adjust the candles’ color in the trading terminal by clicking the right on the charts and selecting Properties – Color scheme.
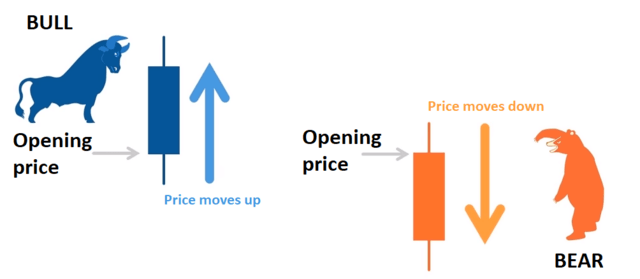
“Bulls” are called buyers who sort of raise the market on the horns and move it up. “Bears” are sellers who bear’s paw push the market down. A Japanese candle is one time period that can be absolutely anything from the minute (M1) to monthly (MN).
How to Read Japanese Candlesticks?
A Japanese candle consists of the body, upper and lower wick/shadow.
The body of a candle is a rectangle between the price of opening and the price of closing the candle.
If the closing price of the candle is higher than the opening price, and the body is painted green, then you have a bull’s candle in front of you. If the closing price of the candle is lower than the opening price, and the body is painted red, then you have a bear candle in front of you.
The maximum and minimum of candles show price fluctuations during a given time period.
Candlestick charts are composed of many individual candles.
Each candlestick reflects information about trading for a certain timeframe. For example, on a fifteen minute (M15) chart, each candlestick contains all the trading information that took place during those fifteen minutes.
The trading information that is displayed in Japanese candles contains data on the opening price of the candlestick, the lowest price, the highest price, the closing price, as well as data on the direction of the candlestick size. All this information is displayed graphically (i.e. it does not need to be calculated), so that visually the information can be analyzed almost instantly.
Let’s break down the different parts of a Japanese candle in detail.
Opening Price
The opening price of a candlestick is depicted on the chart as the wide part of the candlestick combined with its color.
If the Japanese candlestick is pointing up, then the opening price is at the bottom of the wide part of the candlestick. Conversely, if the candle is downward, then the opening price is displayed at the top of the wide part of the candle.
The open price is the price at which the first trade was made in a certain period of time with the Japanese candlestick.
Closing Price
The candlestick closing price on the chart is also displayed on the chart as the wide part of the candlestick in combination with its color.
If the candlestick is pointing up, then the closing price is displayed in the upper wide part of the candlestick. If the candlestick is downward, then the closing price is in the lower wide part of the candlestick.
The closing price is the price at which the last trade occurred during the time frame of the candlestick presented.
High and Low Candles
The highest and lowest candlestick prices are displayed at the top and bottom of the candlestick shadow. High is the highest price at which a trade was made for a specific timeframe of a candle, and Low is the lowest price at which a trade was made over the same period of time.
Candle Direction
The direction of the Japanese candlestick can be determined by the color of the candlestick.
For example, an upward candlestick might be colored green and a downward candlestick colored red.
Most charting programs allow you to independently choose the color of candles, but in order to be able to read Japanese candles, you need to paint upward and downward candles in different colors. The direction contains information about the direction in which the price moved over a certain period of time.
Candle Size
The size of a candle is displayed on the chart as a thin vertical line that goes through the entire candlestick and exits from the top and/or bottom. This line is called the candle shadow or wick.
The range of the candlestick reflects the price volatility over a specific period of time. If the shadow of a candlestick is shorter than that of the previous candlestick, then the price range has narrowed (i.e., volatility has decreased). If the shadow of a candlestick is longer than that of the previous candlestick, then the price range has increased (i.e., volatility has increased).
In order to calculate the range of price movement, subtract the minimum from the maximum price and get the size of the candles.
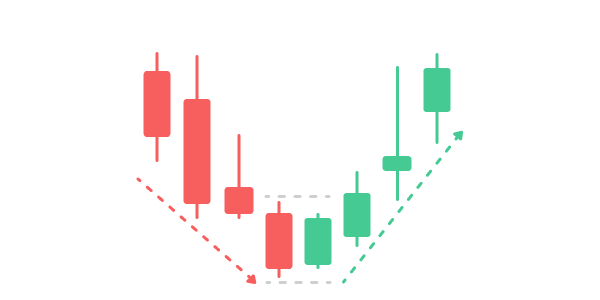
Trend Analysis
Japanese candlesticks can be used to determine trends on a trading chart. The picture shows a downtrend or “bear” trend, a sideways or flat trend, and an uptrend or bullish trend.
Remember that the downtrend is a combination of falling highs and lows, and the uptrend is a combination of rising highs and lows.
Conclusion
Today, we looked at Japanese candle structure, how to read Japanese candlesticks, how to analyze the candles, and learned the difference between “bull” candles and “bears”.


