
One of the secrets to success in forex trading is the ability to closely examine price changes. For this purpose, a key tool used by traders is the forex chart, and not just one but various types of forex charts. This article will cover 3 most commonly used forex chart types that traders use to analyze the market trends – Line Charts, Bar Charts, and Candlestick Charts. Mastering these could give you a significant edge in the forex market, allowing you to predict market movements accurately.
The Importance of Forex Charts
Firstly, let’s understand why they are essential. Forex charts present the price movements of different currency pairs over a period. These charts allow traders to view the market trends, making it possible to predict future price movements. Whether you are a short-term day trader or a long-term investor, these charts are a vital part of your trading toolkit.
Consider forex charts to be land mine detectors that keep you safe and on the right track. After reading this article, you will be able to use a variety of forex charts and anticipate market eruptions. You may be able to make a ton of money if you can improve your ability to analyze forex charts.
But let’s start with the basics. You need a technique to examine the past and present price behavior of a currency pair in order to study how its price changes. Introducing the forex chart and technical analysis.
What are Forex charts?
A forex chart, or more accurately, a price chart, is a graph that shows the prices of different currencies over time. Basically, the forex chart shows how the price of a currency pair or pairs changes over time.
For technical users, Forex charts are very important because they show how currency pairs have done over a certain amount of time, like 10 minutes, 4 hours, a day, or a week. By looking at how prices have moved in the past, it is possible to predict how the market will move in the future. This idea is the most important part of technical analysis.
No matter what trading method you choose, you will need to know how to read forex charts. Whether you’re using a bar chart, a candlestick chart, or a line chart, your goal is the same: to find trade setups with a good chance of success and profit from them.
How to Read a Forex Chart
At first glance, charts may look like rocket science, but they’re not that hard to understand. They are easy to use, and it’s pretty clear how each price change occurs over time. It’s all visible; you don’t have to deal with complicated math or quantum physics.
Before you open a chart on your forex trading tool, it helps to know a few basics. Here are the basics of any trading chart:
The y-axis (the vertical axis) shows the price scale, and the x-axis (the horizontal axis) shows the time scale.
On the x-axis, prices are written from left to right. The most current prices are on the far right.
These parts stay the same whether you’re talking about a bar chart, a candlestick chart, or a line chart. All charts are just pictures of how prices have changed over a certain time frame.
Why Do We Deed Forex Charts?
Timing the market is one of the hardest things that busy traders have to do. Because of this, many traders use forex charts above all else to figure out when they should enter and exit the market.
Chart patterns can help us identify when the market is about to break out, settle, change direction, or extend the trend. And that’s the whole point: to find big changes before they happen so we can ride them out and make money.
After all, who wouldn’t want to swim in a pool of cash? A vertical line that is an income matrix? Complete and total freedom from money worries?
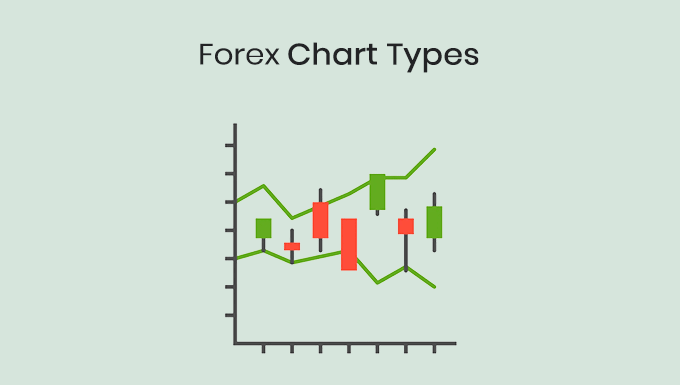
3 Types of Forex Charts
Before we get into the more advanced parts of technical analysis, let’s look at the 3 most common types of forex charts: line charts, bar charts, and candlestick charts.
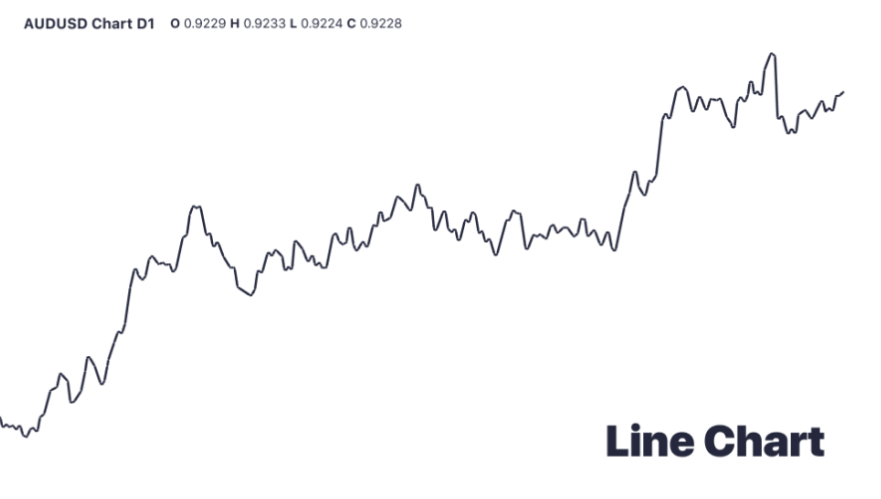
1. Line Chart
Line charts are the simplest among the types of forex charts. They plot the closing prices of a currency pair over a defined period, connecting each data point with a simple line. This linear representation provides a clear and concise overview of price movements over time. Although not as detailed as other chart types, line charts are an excellent starting point for beginners due to their simplicity.
Pros and Cons of Line Charts
While line charts are known for their simplicity, they also have their drawbacks. They are excellent for getting a quick overview of price trends, but they lack the intricate details that other chart types provide. However, for traders who prefer a clutter-free and straightforward perspective of market trends, line charts can be an ideal choice.
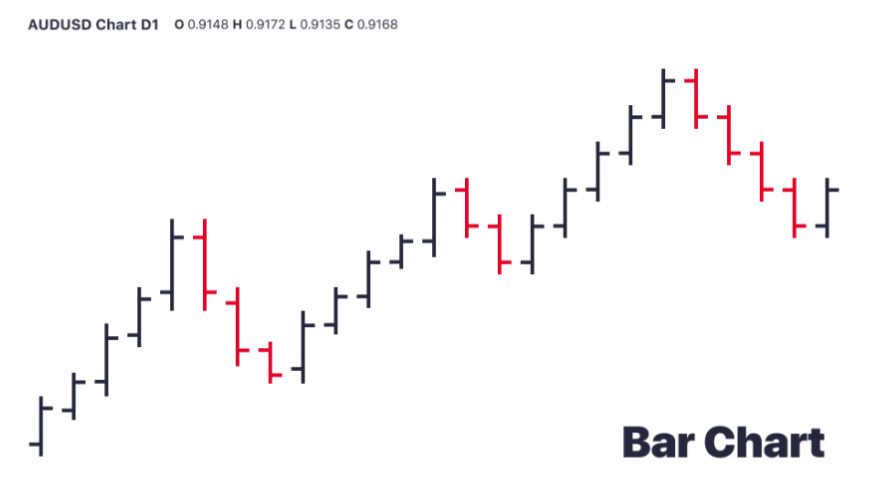
2. Bar Chart
Bar charts, or OHLC (Open, High, Low, Close) charts, take the information game a notch higher. Each bar represents a particular time frame – a day, an hour, or even a minute. The top of the bar shows the highest price point, the bottom indicates the lowest, and the horizontal lines on either side represent the opening and closing prices. Bar charts offer more detail than line charts, making them a popular choice among many traders.
Pros and Cons of Bar Charts
Bar charts provide a wealth of information, giving traders a comprehensive view of price movements. However, this can lead to information overload for novice traders. It’s essential to learn to filter out the noise and focus on significant trends. On the plus side, with experience, bar charts can become an excellent tool for detailed analysis.
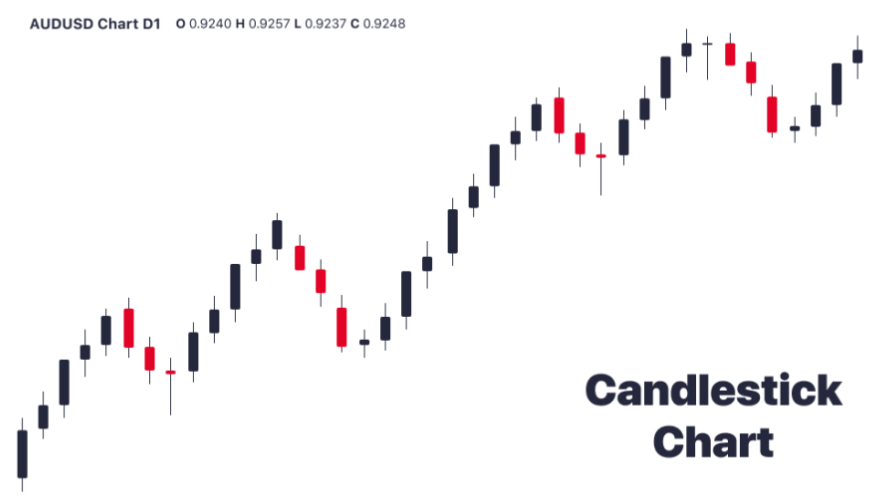
3. Candlestick Chart
Originating in Japan over 300 years ago, candlestick charts have become a go-to for many forex traders. They visually display the open, high, low, and close prices, similar to bar charts, but in a more visually appealing and comprehensive way. The ‘body’ of the candle represents the range between the opening and closing prices, while the ‘wicks’ show the high and low of that period. Different colored candles usually indicate rising or falling trends.
Pros and Cons of Candlestick Charts
Candlestick charts are loved for the depth of information they provide. They can highlight trend reversals and price patterns that could be missed in other chart types. However, this type of chart requires a steeper learning curve and might seem complex to beginners. Nevertheless, mastering candlestick charts can be extremely beneficial for any forex trader.
Which Forex Chart Type is Better?
If you want to trade forex charts, you can choose which type of chart to use. But it’s important to make sure that the chart you use goes well with your plan. After all, putting price changes into a useful context helps a lot.
What exactly do I mean? Let’s look at a quick example. Let’s say you are an hourly scalper looking to make small profits off the EUR/USD. In this case, a line chart of the EUR/USD every month won’t tell you much. Either a 5-minute bar chart or a 30-minute candlestick chart would be a better choice.
Conclusion
Understanding and mastering the different types of forex charts is a significant step in becoming a successful forex trader. While line charts provide a broad overview, bar charts give a more detailed picture, and candlestick charts offer a comprehensive analysis. As a trader, you need to familiarize yourself with these tools and learn how to use them effectively to make informed trading decisions. Remember, the forex market is complex and dynamic, but these charts can turn the odds in your favor.
FAQs
Q: Which type of forex chart is best for beginners?
A: Line charts are typically the best for beginners due to their simplicity and ease of understanding.
Q: How are bar charts and candlestick charts different?
A: Both bar and candlestick charts provide similar information but in different visual representations. Candlestick charts are generally considered more visually appealing and easier to interpret at a glance.
Q: Can I use just one type of forex chart for trading?
A: While you can use one type of chart, it’s better to use a combination of them. Each chart type has its strengths and provides unique insights that can help you understand market trends better.
Q: How often should I check forex charts?
A: This depends on your trading strategy. Day traders may need to check the charts several times a day, while long-term traders might do so less frequently.
Q: Are forex charts hard to read?
A: While forex charts might seem complex initially, with practice and understanding, they become much more straightforward to interpret.


