
Technical analysis gives traders tools that help them identify trends and see when they are about to change. But in addition to technical indicators, candlestick patterns are another way to look at price action.
As you may know, there are several ways to represent the price of an asset, whether it is a currency pair, a company stock, or a cryptocurrency. The three most common types of charts are line charts, bar charts, and candlestick charts. Most traders prefer the bar chart because it provides clearer patterns to anticipate trend reversals or continuations.
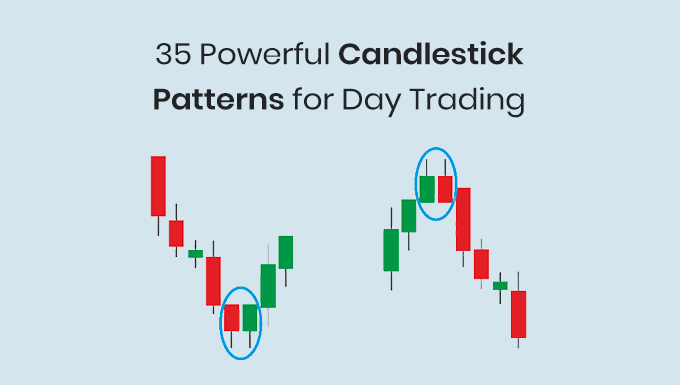
A candlestick pattern is the price movement of an asset that is represented graphically on the candlestick chart (bar chart). When a certain candlestick pattern appears on the chart, it can be used to predict how the price might move.
In this post, I’ll explain you the most important and powerful candlestick patterns so that you can correctly identify trends and reversals.
Table of Contents
• How Does the Candlestick Chart Work?
• Bullish Candlestick Patterns
• Bearish Candlestick Patterns
• Continuation Candlestick Patterns
• Conclusion
What is a Candlestick?
A candlestick is a single bar on a candlestick price chart that allows the trader to see market movements at a glance. Each candle shows the open, low, high, and close of a market for a specified period of time.
The patterns that appear on candlestick charts can help traders predict market movements using technical analysis. Candlesticks are structured as follows:
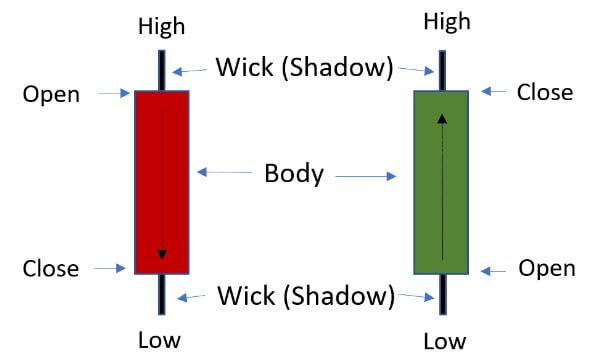
Candle body
The candle body contains the open and close price of an asset. The position of the opening or closing price depends on whether the candle, and therefore the price, is trending up or down in a given period. In a bullish market, the closing price is higher than the opening price and vice versa.
Candle wick/shadow
Every candle generally has what is called a shadow and a wick, although these are not always visible. So the wick represents the high and the shadow the low of the price. Sometimes either only the shadow or wick can be seen. This is when the high or low coincides with the opening or closing price.
Color of the candle
The color of the body indicates the direction of price movement. Typically, a green (or white) body indicates a price increase and a red (or black) body indicates a price decrease. You will see green and red bodies on most platforms. When the body is green, its upper border indicates the closing price.
How Does the Candlestick Chart Work?
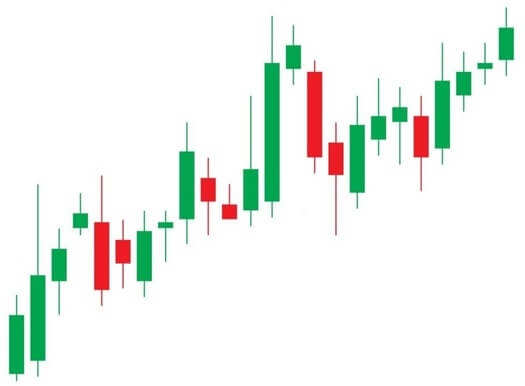
The candlestick chart is by far the most comprehensive way to show the price of an asset. Unlike the line chart, which only shows the closing price, the candlestick chart gives a lot of information about the historical price thanks to its structure (wick/shadow) described above.
Candlesticks form chronologically one after the other and can help you see the overall trend as well as resistance and support levels even without technical indicators. Also, they can form certain patterns that serve as buy or sell signals. Using the candlestick chart is especially important for cryptocurrencies, which are very volatile and need detailed technical analysis.
Candlestick patterns play an important role in technical analysis and can be very useful for traders. If you learn to spot these patterns early on, they will help you gain a real competitive advantage in the markets. Similar to the way that technical indicators like volume, support and resistance levels, RSI, and Fibonacci retracements help you trade, candlestick patterns can help spot trend reversals and continuations early.
There are many different candlestick patterns, but the basic candlestick patterns should be learned and understood by every trader. Now let’s look at these 35 powerful candlestick patterns and start with the bullish patterns that appear after a downtrend and initiate a bullish trend reversal.
Bullish Candlestick Patterns
Bullish reversal patterns appear at the end of a downtrend and signal price reversals to the upside. Here are the main and most common bullish candlestick patterns formed:
Hammer
Hammer is a single candlestick formation that forms at the end of a downtrend and signals an upside reversal.
The actual body of this candle is small and is at the top with a lower shadow that should be more than twice the size of the actual body. This particular candle formation has little or no upper wick.
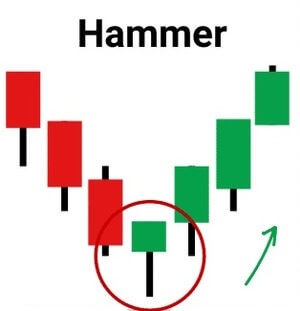
Note: One hammer is enough to provide a trading signal. The gavel can have both a positive close (green) and a negative close (red).
For example, hammers can occur at significant support zones. Various stop-loss orders are then triggered there, which the big boys use for a long entry due to the healthy liquidity.
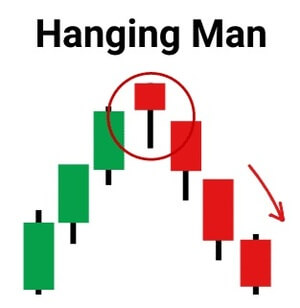
Hanging Man
Caution: risk of confusion! The hanging man looks the same as the hammer and inverted hammer, but the trend trajectory is different.
The image below illustrates the difference between the Hanging Man and the Hammer Candle. The hanging man marks the end of an uptrend, while the hammer marks the beginning of an uptrend. The whole thing then also applies in reverse to the inverted hammer.
Kicker
A kicker is a candlestick pattern that often forms after a significant downtrend, but can also occur after an uptrend.
In short, a bullish kicker consists of a large bullish candle that is preceded by a down sequence.
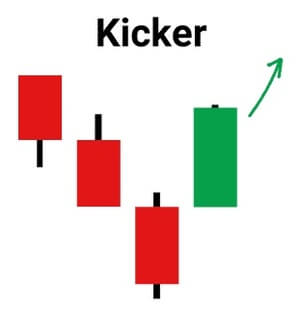
A “kicker” is sometimes referred to as the strongest candlestick pattern of all. You can see why this pattern is so explosive in the chart above. Like most candlestick patterns, there is a bullish and a bearish version.
Piercing
The Piercing candlestick pattern is a trend reversal candlestick chart pattern that forms after a downtrend and indicates a bullish trend reversal.
It consists of two candles, the first of which is a bearish candle, indicating the continuation of the downtrend.
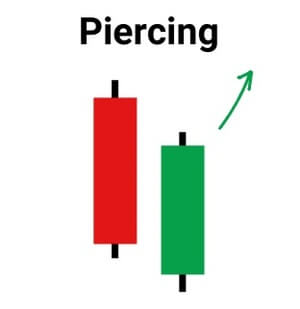
The second candle is a bullish candle that starts with a gap down and closes at 50% or more of the previous candle, indicating that the uptrend is returning in the market and a bullish reversal is occurring.
Traders can enter a long position if there is another bullish candle the next day and set a stop loss at the bottom of the second candle.
Bullish Engulfing
Bullish engulfing is a chart pattern that forms after a downtrend and indicates a bullish trend reversal.
It consists of two candlesticks, with the second candlestick superimposed on the first ; the first candle is bearish and indicates a continuation of the downtrend.
The second candle is a long bullish candle that completely overshadows the first candle, indicating that the bulls have returned to the market.
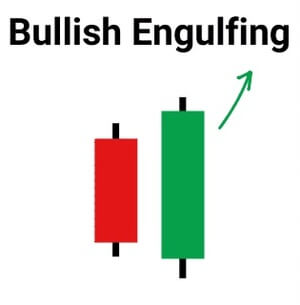
If a bullish candle forms the next day, traders can enter a long position and place a stop loss at the lowest level of the second candle.
Morning Star
The Morning Star is a candlestick formation that forms after a downtrend and indicates a bullish trend reversal .
It consists of three candles : the first is a bearish candle, the second is a doji and the third is a bullish candle.
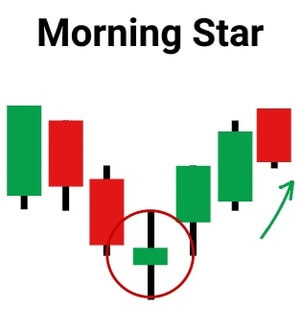
The first candle indicates a continuation of the downtrend. The second candle is a doji indicating market uncertainty. Candle number 3 pointing up suggests that bullish sentiment is returning to the market and a reversal will take place.
The second candle must be completely cut off from the bodies of the first and third candles.
Three White Soldiers
The Three White Soldiers are a set of bullish candlesticks that form a candlestick pattern after a downtrend and suggest upside.
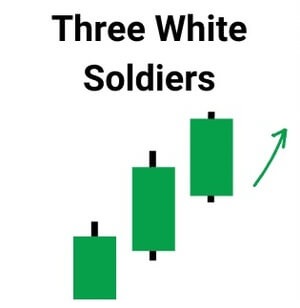
This candlestick formation consists of three long bullish bodies that have no long shadows or wicks and are open within the body of the previous candlestick.
White Marubozu
The White Marubozu is a single candlestick pattern that forms after a downtrend and indicates a bullish reversal.
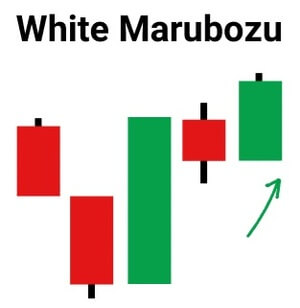
This candle has a long bullish body with no upper wick or lower shadow, suggesting that the bulls may be applying buying pressure and markets could turn higher.
Three Inside Up
The Three Inside Up is a candlestick pattern that forms after a downtrend and indicates upward movement.
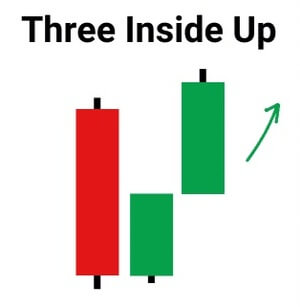
It consists of three candles, where the first is a long bearish candle, the second is a small bullish candle, which should be in the area of the first candle.
The third candle should be a long bullish candle confirming the bullish reversal.
Bullish Harami
The Bullish Harami is a candlestick formation that forms after a downtrend and indicates a bullish reversal.
It consists of two candlestick charts, where the first candle is a large bearish candle and the second is a small bullish candle that should be in the area of the first candle.
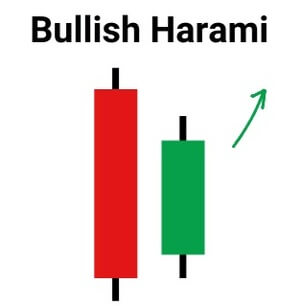
The first bearish candle shows the continuation of the downtrend and the second candle suggests that the bulls are back in the market.
Tweezer Bottom
The Tweezer Bottom candlestick pattern is a bullish reversal candlestick pattern that forms at the end of a downtrend.
It consists of two candlesticks, the first being bearish and the second being bullish. When a tweezer bottom candlestick forms, the previous trend is down.
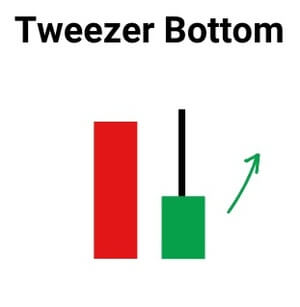
A bearish candle has formed which appears to be continuing the downtrend. The next day, the low of the second day’s bull bar becomes support.
The bottom candle shows an almost identical low, indicating the strength of support and the possibility of the downtrend reversing and turning into an uptrend. This is forcing the bulls to take action and price increases. This bullish reversal is confirmed the next day by the formation of a bullish candle.
Inverted Hammer
The inverted hammer forms at the end of a downtrend and signals a bullish trend reversal. The wick of this candle is particularly pronounced. This is the reverse pattern to the Hammer candlestick pattern.
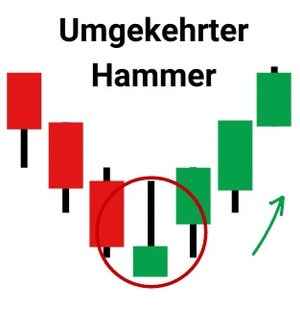
This pattern forms when the open and close prices are close together and the upper wick is at least twice the size of the body.
Three Outside Up
Three Outside Up is a candlestick pattern that forms after a downtrend and indicates upward movement. It consists of three candles, the first of which is a short bearish candle and the second is a large bullish candle designed to cover the first candle. The third candle will be a long bull candle, confirming the bulls’ reversal.
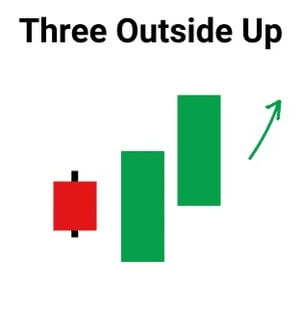
The relationship between the first and second candlestick charts should depict a bullish engulfing candlestick pattern. Once this candlestick formation is complete, a long position can be entered.
On-Neck
An on-neck candlestick pattern occurs when a long bearish candlestick is followed by a small bullish candlestick following a downtrend, opening and closing near the close of the previous candlestick.
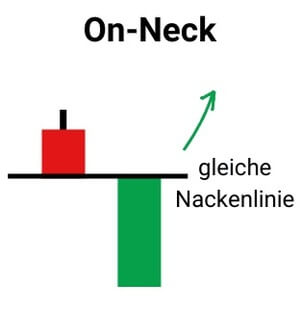
This pattern is called a neckline because the closing prices of the two candles are equal or almost equal, forming a horizontal neckline.
Bullish Counterattack
Bullish Counterattack is a reversal pattern that predicts that the current downtrend in the market will reverse in the future. This pattern is a two bar chart that appears during a market downturn. For it to be a bullish reversal pattern, the following conditions must be true:
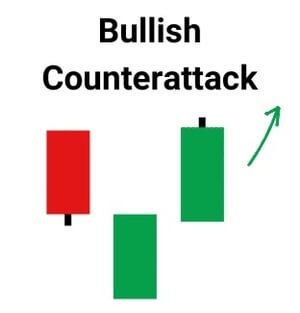
- There must have been a strong downward trend.
- Then a strong positive candle develops.
- The following second candlestick must also be a long (ideally the same size as the first) green candlestick with a real body; close the second candle well above the close of the first candle.
Bearish Candlestick Patterns
Bearish candlestick candlestick patterns suggest that the ongoing uptrend will turn into a downtrend. Therefore, traders should be cautious with their long positions when bearish reversal candlestick patterns form.
The following are the different types of the main bearish candlestick candlestick patterns:
Hanging Man
The Hanging Man is a single candlestick pattern that forms at the end of an uptrend and signals a bearish reversal.
The actual body of this candle is small and is at the top, with a lower shadow that should be larger than twice the actual body. This candlestick pattern has little or no upper shadow.
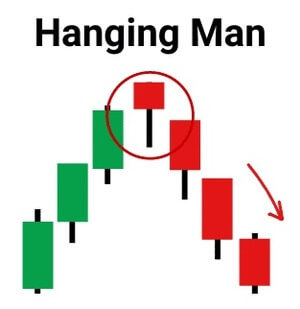
The psychology behind this candlestick formation is that prices opened and sellers pushed prices lower.
Suddenly, the buyers entered the market and pushed the prices up, but failed as the prices closed below the opening price.
This led to the formation of a bearish pattern and means that the sellers are back in the market and the uptrend could end. Traders can enter a short position if a bearish candle forms the next day and place a stop loss at the hanging man high.
Dark Cloud Cover
Dark Cloud Cover is a candlestick pattern that forms after an uptrend and indicates a bearish reversal. It is formed by two candles, where the first candle is a bullish candle that indicates the continuation of the uptrend.
The second candle is a bearish candle that gaps to the upside but closes more than 50% of the previous candle’s real body, suggesting that the bears are back in the market and a bearish reversal will occur.
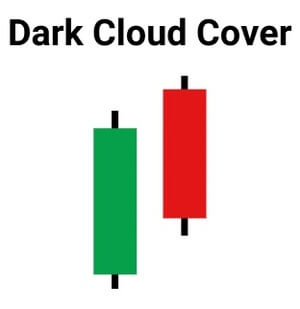
Traders can enter a short position if a bearish candle forms the next day and place a stop loss at the high of the second candle.
Bearish Engulfing
Bearish engulfing is a candlestick pattern that forms after an uptrend and indicates a bearish reversal. It is formed by two candlesticks, with the second candlestick engulfing the first candlestick. The first candle is a bullish candle and indicates the continuation of the uptrend.
The second candle on the chart is a long bearish candle that completely engulfs the first candle and shows that the bears are back in the market.
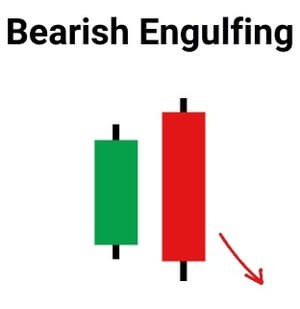
Traders can enter a short position if a bearish candle forms the next day and set a stop loss at the high of the second candle.
The Evening Star
The Evening Star is a candlestick pattern that forms after an uptrend that indicates a bearish reversal. It consists of 3 candles , where the first is a bullish candle, the second is a doji and the third is a bearish candle.
The first candle indicates the continuation of the uptrend, the second candle, which is a doji, indicates market indecision, and the third candle, which indicates a bear market, indicates that the bears are back in the market and a reversal will be held.
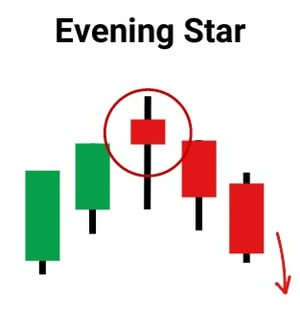
The second candle should be completely out of the real bodies of the first and third candle.
Traders can enter a long position if a bearish candle forms the next day and set a stop loss at the high of the second candle.
Three Black Crowds
The Three Black Crows is a candlestick pattern that forms after an uptrend and indicates a bearish reversal.
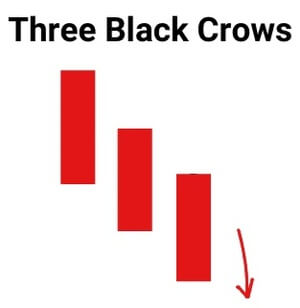
These candlesticks consist of three long bearish bodies that have no long shadows or wicks and open inside the real body of the previous candlestick of the pattern.
Black Marubozu
The Black Marubozu is a single candlestick pattern that forms after an uptrend and indicates a bearish reversal .
This candlestick pattern features a long bearish body with no upper wick or lower shadow, suggesting that the bears could be selling and turning the markets lower.
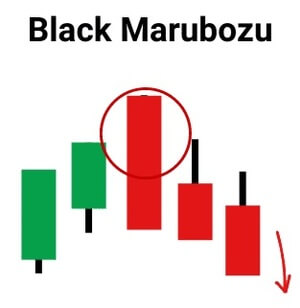
When forming this candle, buyers should be cautious and close their buy position.
Three Inside Down Candles
Three Inside Down is a multiple candlestick pattern that forms after an uptrend and indicates a downside reversal.
The first candle is a long bullish candle, the second candle is a small bearish candle, which should be in the area of the first candle.
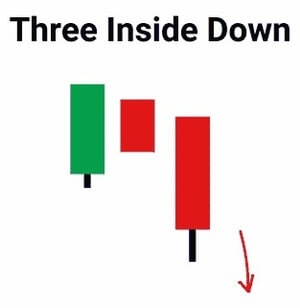
The third candle on the chart should be a long bearish candle confirming the bearish reversal.
The relationship between the first and second candle should match the bearish Harami candlestick pattern. Traders can take a short position after this candlestick pattern completes.
Bearish Harami
The Bearish Harami is a candlestick pattern that forms after an uptrend and indicates a bearish reversal. It consists of two candles, where the first candle is a high bullish candle and the second is a small bearish candle, which should be in the area of the first candlestick chart.
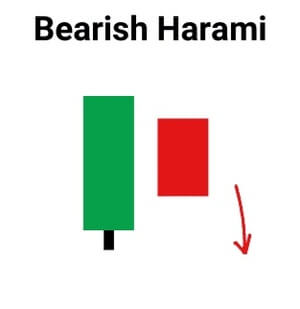
The first bullish candle shows the uptrend continuation and the second candle shows that the bears are back in the market.
Traders can enter a short position after the completion of this candlestick pattern.
Shooting Star
The Shooting Star forms at the end of an uptrend and gives a bearish reversal signal.
In this candlestick chart, the actual body is at the end and there is a long upper wick. It is the reversal of the Hanging Man candlestick pattern.
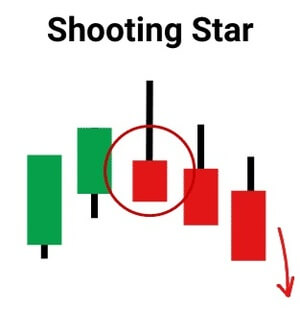
This pattern forms when the open and close prices are close together and the upper wick is more than double the real body.
Tweezer Top
The tweezer top candlestick pattern is a bearish candlestick formation that forms at the end of an uptrend.
It consists of two candles , the first being a bullish candle and the second being a bearish candle. Both tweezer candles are making almost the same high. When the tweezer top candlestick pattern forms, the previous trend is an uptrend. A bullish candle is forming that looks like the continuation of the ongoing uptrend.
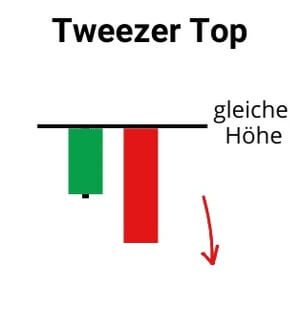
The next day, the high of the second day bearish candlestick indicates a resistance level . The bulls seem to be driving the price higher but are not ready to buy at higher prices now.
The top candles with almost the same high indicate the strength of the resistance and also signal that the uptrend could reverse and form a downtrend. This bearish reversal will be confirmed the next day when the bearish candlestick forms.
Three Outside Down
The Three Outside Down is a candlestick formation that forms after an uptrend and indicates a bearish reversal.
It consists of three candles, with the first being a short bullish candle and the second being a large bearish candle that should cover the first candle. The third candle should be a long bearish candle confirming the bearish reversal.
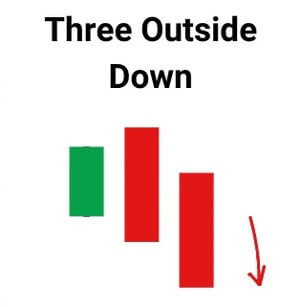
The relationship between the first and second candle should match the Bearish Engulfing Candlestick pattern. Traders can take a short position after the completion of this candlestick pattern.
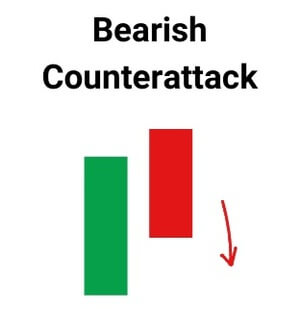
Bearish Counterattack
The Bearish Counterattack Candlestick Pattern is a bearish reversal pattern that occurs during an uptrend in the market. It predicts that the current uptrend in the market is coming to an end and a new downtrend is taking over the market.
Continuation Candlestick Patterns
The concept of a continuation pattern is more in line with the idea of trend following . i.e. price has already moved in one direction and the trend follower is looking for opportunities to enter the market and continue the trend.
Although reversal patterns are more familiar, this concept is more about spotting tops and bottoms, which is more difficult to accomplish and more prone to false signals. Trends often last longer than many expect. The trend is your friend until it ends!
Doji
The doji pattern is an indecisiveness candlestick pattern that forms when the opening and closing prices are almost equal.
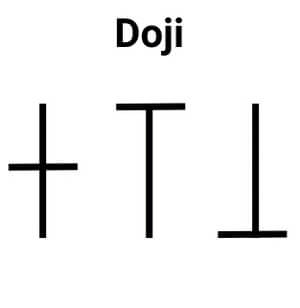
It forms when both the bulls and bears fight for control of the prices, but neither manages to gain full control of the prices.
The Candlestick candlestick pattern looks like a cross with a very small real body and long shadow or wick.
Spinning Top
The spinning top candlestick pattern is the same as the doji pattern that indicates indecisiveness in the market.
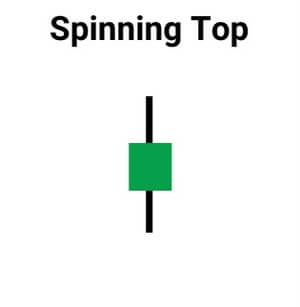
The only difference between spinning top and doji is the formation: the real body of the spinning is larger than that of the doji.
Falling Three Methods
The falling three methods is a bearish five candlestick continuation pattern that indicates a break but no reversal in the ongoing downtrend.
The candlestick pattern consists of two long candlestick charts in the direction of the trend, ie a downtrend at the beginning and end, and three shorter candlesticks in the middle, counteracting the downtrend.
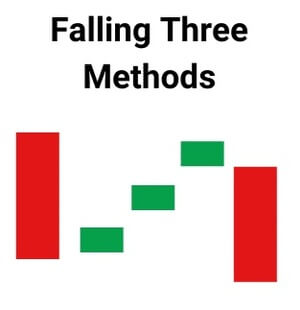
The candlestick pattern is important as it shows traders that the bulls do not yet have enough power to reverse the trend.
Rising Three Methods
The “ rising three methods ” is a bullish five-bar continuation pattern that signals a break, but not a reversal, in the ongoing uptrend.
This candlestick pattern consists of two long candlesticks in the direction of the trend, ie uptrend in this case, at the beginning and the end, and three shorter candlesticks in the middle, counter to the trend.
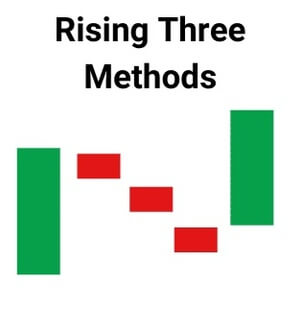
The candlestick pattern is important as it shows traders that the bears do not yet have enough power to reverse the trend.
Tasuki Gap (Upside Tasuki)
It is Upside Tasuki , a bullish continuation candlestick pattern formed in an ongoing uptrend.
This candlestick formation consists of three candlesticks. The first candle is an elongated bullish candle and the second candle is also a bullish candle that forms after a gap to the upside.
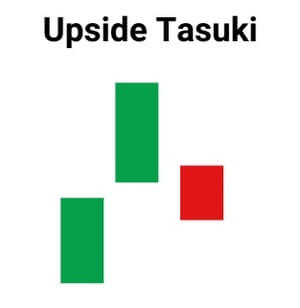
The third candle is a bearish candle that closes the gap between the first two bullish candles.
Mat Hold
A mat-hold pattern is a candlestick formation that indicates the continuation of a previous trend.
There are both bearish and bullish mat hold patterns. A bullish pattern starts with a large bullish candle, followed by a gap to the upside and three smaller candles moving down.
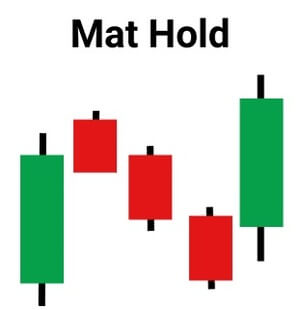
These candles must stay above the bottom of the first candle. The fifth candle is a large candle moving back up. The pattern occurs within a general uptrend.
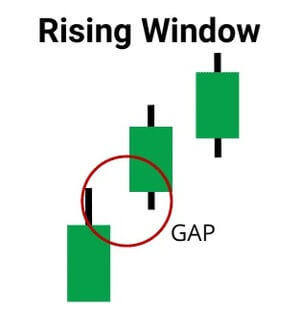
Rising Window
The Rising Window is a candlestick pattern consisting of two bullish candlesticks with a gap between them. The gap is a gap between the high and low of two candlesticks created due to high trading volatility. It is a trend continuation candlestick pattern that indicates strong buyers in the market.
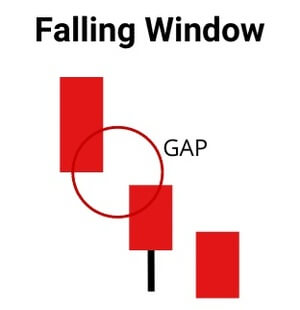
Falling Window
The falling window is a candlestick pattern consisting of two bearish candlesticks with a gap between them. The gap is a space between the high and the low of two candlesticks. This is a trend continuation candlestick pattern that indicates the strength of the sellers in the market.
High Wave
The high wave candlestick pattern is an indecision pattern that shows that the market is neither bullish nor bearish. It mostly occurs at support and resistance levels.
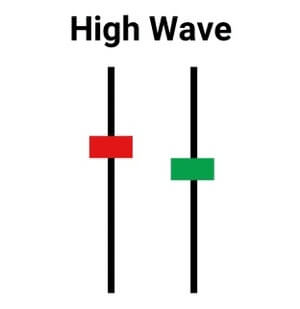
This is where bears and bulls fight each other, trying to push the price in a certain direction. High waves represent the candlestick pattern with long lower shadows and long upper wicks. They also have small bodies. The long wicks indicate that there was a large price move on that time frame. Eventually, however, the price closed near the open price, thus representing market indecision.
Conclusion
In summary, candlestick patterns, while technical, are extremely effective for spotting trend reversals early. This completes the basic knowledge of candlestick formations and patterns. Now how can you start using them? Here are some things to keep in mind:
- Do not trade based solely on candlesticks. Candlesticks can tell you a lot about an asset’s dynamics, but they should only be part of your research. Be sure to back up your chart analysis with fundamental analysis and indicator testing.
- Shadows and wicks are important. A long shadow or wick can be an indication that there is resistance to buying or selling pressure… And one always comes out on top.
- The time frame is important. Don’t make the mistake of thinking you’re seeing something without considering the overall time frame. An hourly chart differs significantly from a daily chart.


Nice work