
The Average Directional Index (ADX) is a commonly used indicator that measures the strength of market trends. Traders, whether novices or seasoned professionals, turn to the ADX to improve their strategies, aiming to capture profitable trends while cutting down potential market noise. However, the efficacy of the ADX is not a given—it must be used with the best ADX settings for day trading. From the 1-minute chart to the 1 hour timeframes, optimizing ADX’s settings is very important. This article discusses how traders can apply the ADX across various timeframes to ensure they’re always in sync with the market’s pulse.
Understanding the Basics of ADX
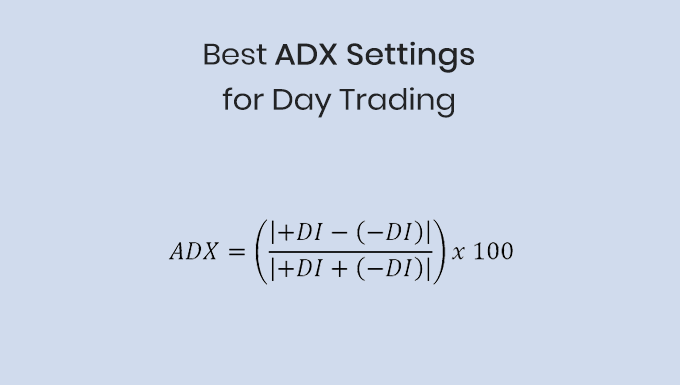
The Average Directional Index (ADX) is a popular technical indicator for day traders, used to determine the strength of a trend. Whether you’re scalping or trend trading, the ADX offers insights that can shape your trading strategy. Basically, its main goal is not to identify the direction of the trend but to measure its momentum.
For various chart timeframes, including 1 minute, 5 minutes, 15 minutes, and 1 hour, ADX settings can significantly influence the accuracy of trading signals. It’s crucial to understand that there’s no one-size-fits-all when it comes to these settings. Factors like the asset being traded, overall market volatility, and individual trading strategy all play roles in determining the ideal settings.
When we dive into shorter timeframes, the market’s noise becomes a significant concern. Thus, using the ADX with correct settings requires fine-tuning to ensure reliable readings. This fine-tuning is less of a concern with longer timeframes, but they bring other challenges into the mix.
For many, the ADX is a must in trend-following strategies. However, the index’s value lies not just in identifying strong trends but also in highlighting potential weak or sideways markets, making it essential to understand its basics and application across different timeframes.
Best ADX Settings for 1 Minute Chart
Every tick and movement is more noticeable when you look at the 1-minute chart, which is full of action. Day traders and scalpers who want to make money off of small price changes like this tiny view of the market. The ADX, within this rapid-paced environment, must be appropriately adjusted to deliver meaningful insights.
Given the transitory nature of trends in the 1-minute chart, the default ADX setting of 14 might not be agile enough to capture these swift movements. Therefore, a shorter period, typically between 5 and 8, is often preferred by traders navigating this timeframe. The reduced period aims to make the ADX more responsive to the chart’s rapid price changes, thereby providing timely insights into trend strength or weakness.
However, with such heightened sensitivity, the risk of over-reacting to market noise increases. The ADX might produce more false signals in its attempt to keep up with the pace. As a countermeasure, traders should consider using the ADX alongside other fast-reacting indicators, like short-term moving averages or the stochastic oscillator, to validate signals and provide a more accurate reading of the market.
The 1-minute chart is not for the faint-hearted. It requires keen observation, swift decision-making, and tools that can keep up with its pace. When optimized correctly, the ADX becomes a crucial ally, guiding traders through the rapid ebbs and flows of the market.
Best ADX Settings for 5 Minute Chart
A 5-minute chart is an arena of rapid movements and swift changes. In such a volatile market, traders need tools that can keep up, and the ADX, when set correctly, can be that tool. For this specific timeframe, the default ADX setting, typically set at a period of 14, may not always provide the most timely signals.
Many traders, aware of the fast-paced nature of the 5-minute chart, tend to reduce the ADX period. This adjustment makes the indicator more responsive to price changes. A period setting between 7 and 10 might be considered more suitable for such short timeframes, offering a balance between responsiveness and reliability.
However, with increased sensitivity comes the risk of the ADX becoming too erratic. Traders should be wary of potential false signals, which can be more frequent with lower settings. This challenge underscores the importance of combining the ADX with other technical indicators to confirm signals and weed out potential false alarms.
Despite the risks, when optimized correctly, the ADX can be an incredibly potent tool for the 5-minute chart trader. By providing a clear picture of the trend’s strength, traders can make informed decisions and navigate the tumultuous waters of short-term trading.
Best ADX Settings for 15 Minute Chart
The 15-minute chart strikes a balance between the frantic pace of the 5-minute chart and the slower, more methodical movements of longer timeframes. Here, the ADX can serve as a reliable ally in identifying strong trends amidst market noise. For this timeframe, traders often stick closer to the default setting of 14, though some minor adjustments can be made to enhance accuracy.
Fine-tuning for the 15-minute chart might involve testing ADX periods around 12 to 16. This range maintains a certain level of sensitivity to price movements while still filtering out some of the market noise. It’s a delicate balance, but when struck, the ADX can provide very reliable signals about trend strength or weakness.
In this medium-short timeframe, the combination of the ADX with other technical tools becomes even more critical. Pairing it with the likes of moving averages or Bollinger Bands can help traders validate signals and create a more holistic trading approach.
Ultimately, while the 15-minute chart does present its own challenges, with the right ADX settings and a multi-indicator strategy, traders can harness its potential and uncover profitable trading opportunities.
Best ADX Settings for 1 Hour Chart
As we move to the 1-hour chart, the dynamics shift again. The longer timeframe provides more data points, and consequently, the ADX becomes less prone to the noise of shorter charts. For many traders, the default setting of 14 remains an excellent starting point. However, there’s always room for optimization.
Some traders, aiming to capture longer trends and filter out minor price fluctuations, might consider increasing the ADX period. Settings around 18 to 22 could be suitable for those looking to harness major movements. An increased period makes the ADX smoother and less reactive to small changes, potentially filtering out insignificant fluctuations.
But as always, increasing the period comes with its trade-offs. A less responsive ADX might lag in identifying emerging trends, especially in markets characterized by frequent trend reversals. Therefore, constant backtesting and adjustments based on recent market conditions are essential.
For the 1-hour chart, the ADX remains a crucial tool. With the right settings and combined with other indicators, traders can get a clear picture of the market, allowing for strategic entries and exits.
Conclusion
The Average Directional Index (ADX) is a useful indicator for figuring out how strong a trend is. But it is really powerful when used with the best ADX settings for intraday trading. With ideal settings and combined with other technical indicators, the ADX provides traders with better insights, allowing them to make correct trading decisions. Understanding and making the most of the ADX settings can be the key to a more successful and well-informed trading journey, no matter what trade style or timeframe you prefer.
FAQs
1. How does the ADX vary across different timeframes like 5 minutes and 1 hour?
Different timeframes capture varying degrees of market movements, with shorter timeframes like the 5-minute chart displaying more minor fluctuations compared to the broader strokes of the 1-hour chart. Depending on the timeframe, traders might need to adjust the ADX’s settings to capture the most accurate reading of trend strength. For instance, on a 5-minute chart, a shorter ADX period might be preferable, while the 1-hour chart might fare well with the default or slightly adjusted settings.
2. Why is it crucial to optimize the ADX settings for each specific timeframe?
Each timeframe captures a unique segment of market activity, with distinct levels of volatility and trend duration. Using a standardized ADX setting across all timeframes might result in misleading indications of trend strength. By optimizing the ADX for each specific timeframe, traders can get a clearer picture of the market’s momentum, making more informed decisions.
3. For daily timeframes, what adjustments to the ADX might be beneficial?
Given the extended nature of daily charts, which encapsulate a full trading day’s data, the default ADX setting of 14 might be adequate for many traders. However, to prioritize more prolonged and stronger trends over short-lived ones, adjusting the ADX period to between 24 and 30 days could be beneficial.
4. What are the challenges in using the ADX for the 1-minute timeframe?
The 1-minute chart is notably volatile, with swift market movements. An ADX optimized for this timeframe can be highly responsive but might also be prone to over-reacting to market noise. This heightened sensitivity could lead to more false signals, so it’s essential to use the ADX alongside other rapid-reacting indicators when trading on a 1-minute chart.
5. Why is it recommended to use the ADX in tandem with other technical indicators?
While the ADX is a potent tool for gauging trend strength, it doesn’t operate in isolation. Other market factors and dynamics can influence price movements. Pairing the ADX with other technical indicators helps validate its signals, offering a more rounded and comprehensive understanding of market behavior, thereby reducing the risk of false or misleading signals.


