
The Relative Strength Index (RSI) indicator is a popular technical indicator among many traders. This momentum oscillator not only measures the speed and change of price movements, but it can also provide key insights into potential buy and sell points. Whether you’re new to the trading world or looking to refine your techniques, understanding the best way to use RSI indicator can give you a crucial edge in the market. This guide will help you understand how to use RSI indicator, offering a comprehensive overview and actionable insights.
Table of Contents
• Divergence in RSI and Its Significance
• How to Use RSI Indicator in Trending vs. Ranging Markets
• Incorporating RSI into a Trading Strategy
• Common Mistakes When Trading with RSI
• How Timeframes Can Impact RSI Analysis
• Combining RSI with Other Technical Indicators
• Conclusion
• FAQs
1. Understanding the Basics of the RSI
What is the RSI?
The RSI, or Relative Strength Index, is a momentum oscillator developed by J. Welles Wilder in 1978. It evaluates the magnitude of recent price changes to determine overbought or oversold conditions in the price of a stock or other asset.
Calculation Behind the RSI
RSI is calculated using the formula: RSI=100−1001+RS Where RS (Relative Strength) is the average of ‘x’ days’ up closes divided by the average of ‘x’ days’ down closes.
Typical Settings and Thresholds
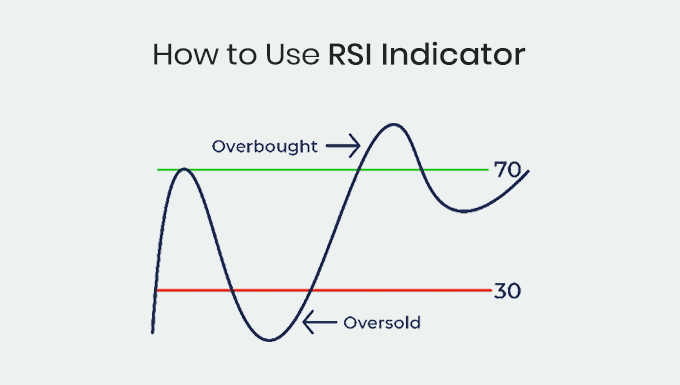
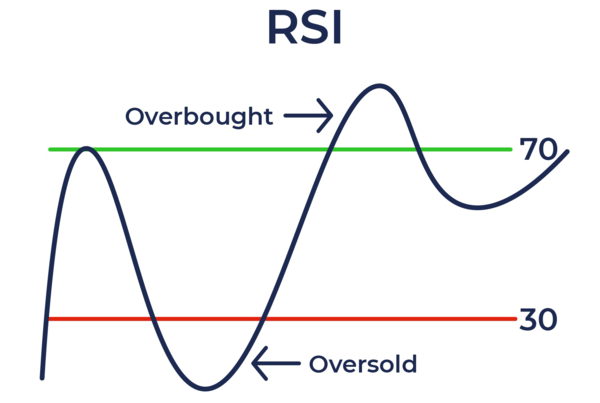
The RSI oscillates between 0 to 100. Traditionally, an RSI above 70 indicates that an asset is overbought, suggesting it might be time to sell. Conversely, an RSI below 30 indicates an oversold condition, which might be a buying opportunity.
Historical Relevance of the RSI
Since its inception, the RSI has been a favorite among traders for its simplicity and efficiency. It offers a clear picture of an asset’s current condition relative to its past, making it a handy tool in predicting future price actions.
The 50-line Crossover
The RSI 50-line crossover is another method traders use to generate signals. When the RSI crosses above the 50 line, it might be a bullish signal, and when it drops below, it could be bearish. This is often seen as a confirmation of a trend.
2. Divergence in RSI and Its Significance
Identifying Divergence
Divergence occurs when the price of an asset is moving in the opposite direction of a technical indicator, such as the RSI. It’s often a sign that the current trend is weakening and might reverse soon.
Bullish vs. Bearish Divergence
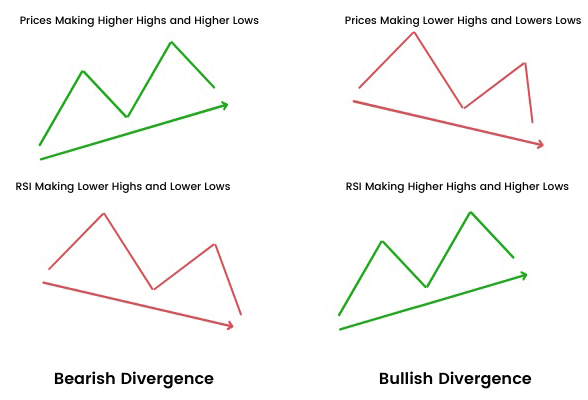
Bullish divergence is spotted when the price is making lower lows, but the RSI is making higher lows. This suggests that while the price is declining, the momentum behind the selling is decreasing. On the other hand, bearish divergence happens when the price is making higher highs, but the RSI is making lower highs, indicating potential weakness in the uptrend.
False Divergence Signals
Not all divergences guarantee a trend reversal. There are times when the market can continue in its prevailing direction despite divergence. It’s essential to use additional confirmation tools or techniques.
Using Divergence in Conjunction with Other Indicators
Many traders prefer to use RSI divergence in tandem with other technical indicators, such as MACD or moving averages. This increases the reliability of the signals produced.
Examples of Successful Divergence Trading
History has seen several instances where RSI divergence has been a precursor to significant price reversals. For instance, during [specific market event], the RSI showed clear signs of divergence before the market made a substantial move.
3. How to Use RSI Indicator in Trending vs. Ranging Markets
Recognizing Market Conditions
Before using RSI, it’s important to determine whether the market is trending or ranging. A trending market experiences clear upward or downward movement, while a ranging market oscillates between parallel resistance and support levels.
RSI in a Trending Market
In trending markets, traditional RSI levels may need adjustment. This is because strong momentum in one direction can keep prices (and thus RSI readings) elevated or depressed for extended periods.
- Bullish Trends: In an upward trend, the RSI might rarely drop to the traditional 30 (oversold) level. Instead, the 40 or even 50 level can act as a new benchmark for oversold conditions. When RSI retraces to these levels, it might present a buying opportunity within the context of the ongoing bullish trend.
- Bearish Trends: Conversely, in a pronounced downward trend, the RSI might seldom reach the 70 (overbought) level. The 60 or 50 levels can serve as potential overbought thresholds, indicating possible areas to consider short-selling or exiting long positions.
RSI in a Ranging Market
Ranging markets revert to the classic interpretation of RSI, but with additional nuances:
- Oversold & Overbought Zones: The conventional wisdom of viewing readings below 30 as oversold and those above 70 as overbought applies more rigorously. Traders can consider buying near support when RSI dips below 30 and selling or taking profits near resistance when RSI exceeds 70.
- RSI Divergences in Ranges: While divergences (where price and RSI move in opposite directions) are valuable in all market contexts, they can be particularly revealing in ranges. For instance, if prices form a new low within the range but RSI forms a higher low, it might suggest weakening bearish momentum and a potential upside reversal.
Adjusting RSI Settings
Depending on market volatility and timeframe, traders sometimes adjust the RSI’s period. A shorter period (like 5) can make the RSI more reactive, while a longer period (like 21) smoothens it.
The Importance of Confirmation
Regardless of the market condition, always seek additional confirmations from other indicators or price patterns before making a trading decision based on RSI. For example, the ADX (Average Directional Index) can help gauge trend strength. A rising ADX alongside supportive RSI readings can confirm of a new trend.
4. Incorporating RSI into a Trading Strategy
Creating a Multi-Indicator Strategy
While RSI is potent, combining it with other technical indicators, such as the Moving Average Convergence Divergence (MACD) or Bollinger Bands, can offer more reliable signals.
Setting Stop-Loss and Take-Profit Levels
When using RSI signals to enter a trade, determine logical stop-loss and take-profit levels. One could set stop-losses near recent highs or lows or use Average True Range (ATR) for dynamic stops.
Backtesting RSI-based Strategies
Before committing real capital, backtest any RSI-based trading strategy on historical data. This provides insights into its efficacy and areas of improvement.
Review and Refinement
Regularly review your RSI strategy’s performance. Markets evolve, and continuous refinement ensures your approach remains in tune with current conditions.
Maintaining Discipline
Trading emotions can lead to impulsive decisions. Always adhere to your strategy rules, ensuring you act on genuine RSI signals and not on hunches.
5. Common Mistakes When Trading with RSI
Overreliance on RSI Alone
The most common error is using RSI as the sole decision-maker. While the 70 (overbought) and 30 (oversold) levels are classic benchmarks, adhering strictly to these without considering market context can be misleading. RSI should complement other analysis tools, not replace them.
- Tailoring to Currency Pairs: Different currency pairs have unique volatility profiles. For example, a major pair like EUR/USD might behave differently from a more volatile exotic pair. Adjusting RSI thresholds to match the specific pair can lead to better signal accuracy.
Ignoring Broader Economic Indicators
Forex markets are deeply influenced by major news events and economic indicators. Solely relying on RSI without considering the broader economic context might lead to misguided trades.
- Stay Informed: For instance, if the RSI indicates an oversold condition for a currency, but upcoming economic data or central bank decisions are expected to be unfavorable for that currency, it might not rebound as RSI suggests.
Ignoring Overall Market Sentiment
It’s essential to consider larger market trends and not just immediate RSI values. Even if the RSI suggests a buy, it might be ill-advised in a broader bearish trend.
- Sync with the Trend: For instance, in a broader market downtrend, an asset showing an oversold RSI might not rebound as anticipated. Aligning RSI signals with the larger trend can increase the probability of successful trades.
Overlooking Divergences
Divergences between the RSI and currency pair movements can indicate significant reversals or continuations.
- Spotting Early Signs: An RSI making higher lows while the asset price makes lower lows might signal a bullish divergence, hinting at potential upside. Conversely, the RSI making lower highs while the asset price makes higher highs could suggest bearish divergence. Regularly scrutinizing the RSI alongside price action can uncover these valuable hints.
Failure to Adjust Settings
Sticking rigidly to the standard 14-period RSI setting isn’t always ideal. Depending on the asset and timeframe, tweaking these settings might be beneficial.
Neglecting Volume Data
The RSI does not consider volume in its calculations, but volume is a crucial aspect of market analysis.
- Volume Confirmation: A move in price backed by high volume is generally considered more robust. For example, if a currency pair shows an oversold RSI and there’s a subsequent rise in a high liquidity environment, it might indicate a stronger, more sustainable upward move.
Chasing Every Signal
While the RSI can be a responsive indicator, acting on every minor signal can lead to frequent, potentially unprofitable trades.
- Timeframe and Session Consideration: Consider the trading session (Asian, European, American) and the timeframe you’re working with. Some RSI signals might be more relevant during specific sessions, and combining RSI with other indicators can help in filtering out weak or false signals, especially in lower timeframes.
6. How Timeframes Can Impact RSI Analysis
Short vs. Long Timeframes
A shorter timeframe, such as a 5-minute chart, will display more RSI fluctuations than a daily or weekly chart. It’s essential to align your RSI analysis with your trading style: scalpers might prefer shorter timeframes, while swing traders might look at daily charts.
RSI Sensitivity and Timeframes
The RSI’s sensitivity increases with shorter timeframes, often leading to more overbought and oversold readings. This can be both an opportunity and a pitfall, depending on the situation.
Consistency is Key
When analyzing multiple timeframes, ensure that RSI readings are consistent across them. For instance, an overbought reading on both daily and weekly charts can reinforce a potential selling signal.
Confirming Breakouts and Reversals
Using RSI on multiple timeframes can help validate breakouts or trend reversals. An RSI divergence on a 4-hour chart supported by a similar divergence on a daily chart can strengthen the reversal signal.
Dealing with Conflicting Signals
At times, RSI values on different timeframes might conflict. It’s crucial to prioritize the timeframe that aligns best with your trading horizon and strategy.
7. Combining RSI with Other Technical Indicators
RSI and Moving Averages
Moving Averages (MAs) are among the most commonly used indicators in forex trading. They help identify the prevailing trend by averaging out price data.
- Confluence with MAs: If the RSI is signaling an oversold condition and the price is approaching a significant Moving Average support (like the 50 or 200-period MA), it can reinforce a potential bullish reversal. The opposite is true for overbought conditions and MA resistance levels.
RSI and Bollinger Bands
Bollinger Bands can be applied to the RSI chart itself. Bollinger Bands comprise a middle band (SMA) and two outer bands representing standard deviations. When the RSI line touches the upper band, it might be overextended, and when it touches the lower band, it could be oversold.
- Volatility and Reversal: When price touches or pierces an outer Bollinger Band while RSI indicates overbought/oversold, it can be a sign of a potential price reversal, especially if the price is stretching the bands significantly.
RSI and MACD
Combining RSI and MACD can provide powerful insights. MACD is a momentum oscillator derived from the difference between two MAs.
- Signal Reinforcement: If the RSI and MACD both show bullish momentum (e.g., RSI moving above 30 and MACD line crossing above the signal line), it might indicate a stronger upward move.
- Divergences: When RSI and MACD show conflicting signals, it can be a warning. For instance, if the RSI is showing an overbought condition while MACD remains bullish, it can indicate a potential cooling period or reversal.
RSI and Fibonacci Levels
Drawing Fibonacci retracement levels on the RSI chart can indicate potential turning points. Fibonacci retracements use horizontal lines to indicate potential support and resistance levels based on the Fibonacci sequence.
- Confluence of Levels: If a currency pair retraces to a significant Fibonacci level (like 61.8%) while RSI indicates an oversold condition, it could suggest a potential bullish bounce from that level.
RSI and Stochastic Oscillator
Both the RSI and Stochastic Oscillator measure momentum, but their calculations differ, offering nuanced views.
- Dual Confirmation: If both RSI and Stochastic indicate oversold conditions, it may present a more robust buying opportunity. Likewise, if both show overbought, it might be a selling signal.
- Differentiating False Signals: At times, one indicator might give a false signal, but having the second one for confirmation can filter out potential pitfalls.
RSI and Volume
While forex is decentralized and lacks a universal volume measure, some platforms offer “tick volume” or other liquidity indicators.
- Momentum Confirmation: An oversold RSI signal combined with a surge in volume (or tick activity) can indicate strong buying interest and potential for price appreciation.
Conclusion
The RSI is undoubtedly a powerful tool when used effectively. Its ability to pinpoint potential overbought and oversold conditions makes it a staple in the realm of technical analysis. However, like any technical indicator, its efficiency relies on the user’s understanding and application. I hope this guide helped you learn how to use RSI indicator, from its basics to its advanced applications. Whether you’re a seasoned trader or a novice, understanding and mastering the RSI can pave the way for informed trading decisions and, ultimately, success in the market.
FAQs
1. Can I use RSI as a standalone indicator for my trading decisions?
While the RSI is a powerful indicator, it’s typically not recommended to rely on it exclusively. Incorporating additional indicators and analysis methods can provide a more well-rounded view of the market and improve decision-making.
2. How frequently should I adjust RSI settings for optimal results?
Adjusting the RSI settings is crucial for aligning with different trading timeframes. Although the standard settings for RSI (14 periods) are commonly used, different assets or market conditions might require adjustments. Periodically test shorter or longer periods to see if they offer better signals for your specific scenario.
3. Is RSI suitable for both day trading and long-term trading?
While RSI is often used in short-term trading due to its sensitivity to recent price changes, it can also provide value in long-term investment strategies, especially when identifying potential entry or exit points in larger trends.
4. How does the RSI perform during major news events?
During significant news events, markets can be extremely volatile. The RSI can enter overbought or oversold territories quickly, and it might not reflect actual market conditions. It’s recommended to approach RSI readings with caution during these times.
5. What are the common mistakes traders make when using the RSI indicator?
Common mistakes include over-relying on RSI in isolation, misinterpreting overbought and oversold levels as immediate buy/sell signals, failing to consider the overall market context, and not adjusting RSI settings according to the trading timeframe and asset.


