Knowing how to use ADX indicator correctly can be very useful for traders to identify the strength of market trends. However, its usefulness depends on how well a trader can interpret and apply it accurately. This article seeks to simplify the complicated ADX by explaining its components, how it can be used in real life, and strategies for maximizing its potential in Forex trading.
Table of Contents
• Components of the ADX Indicator
• How to Set Up the ADX Indicator on Your Trading Platform
• Interpreting ADX Values: From Weak to Strong Trends
• How to Use ADX Indicator With Your Trading Strategy
• Combining the ADX with Other Technical Indicators
• Common Mistakes to Avoid When Using the ADX Indicator
• Conclusion
• FAQs
Understanding the Basics of the ADX Indicator
The ADX, or Average Directional Index, is a technical indicator used in trading to determine the strength of a trend.
What is the ADX?
The ADX is part of the Directional Movement System introduced by J. Welles Wilder in 1978. Its primary function is not to determine the direction of a trend, but rather its strength.
It is a very important technical indicator for forex traders. It’s not a standalone indicator that provides buy or sell signals but rather a measure of trend strength. Given that the Forex market is marked by volatility, understanding the strength of a trend can be incredibly valuable.
Why is the ADX so essential for traders? Firstly, it offers insight into whether the price is witnessing a strong trend or if it’s merely moving sideways. One of the most important things that many Forex traders do is take advantage of strong trends.
ADX Range
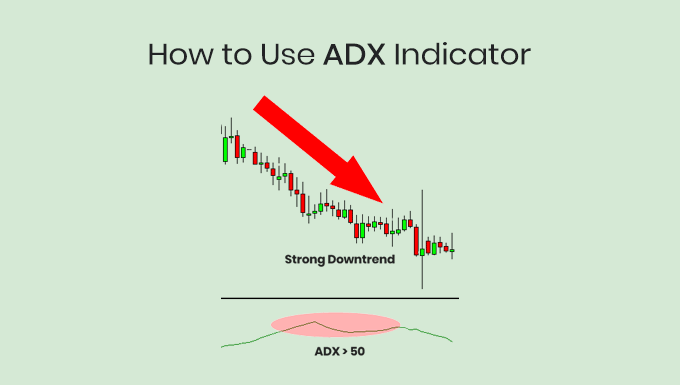
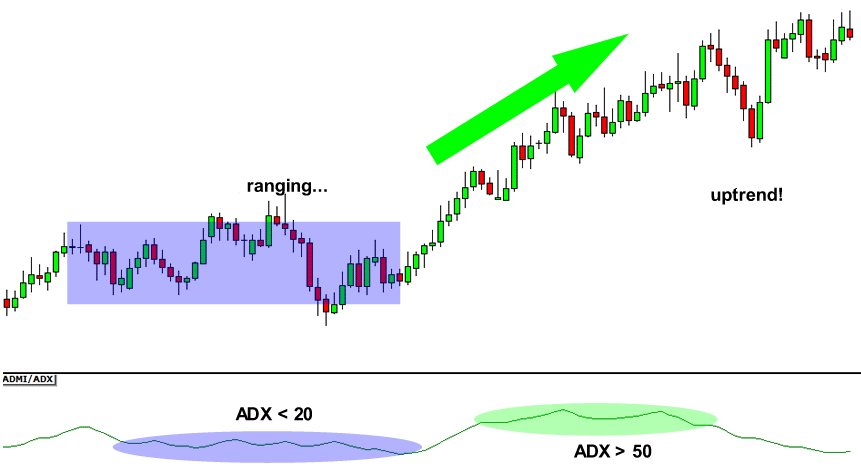
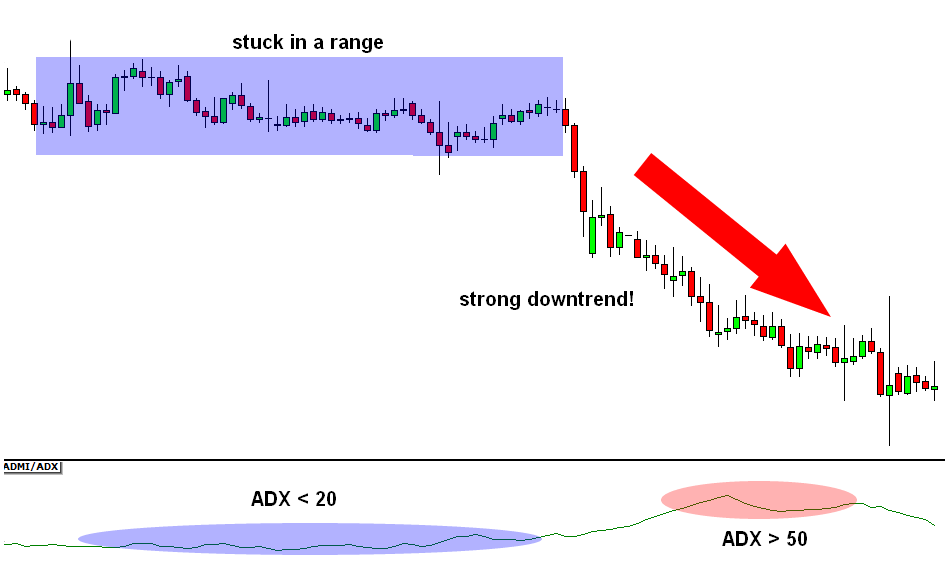
Typically, the ADX oscillates between 0 and 100. A reading below 20 suggests that the trend is weak, while a reading above 50 indicates a strong trend. This feature makes it relatively straightforward to interpret, with higher values indicating stronger trends.
How to Calculate ADX?
To compute the ADX, one first calculates the positive and negative directional movement (referred to as +DM and -DM) and then the True Range. The ADX itself is derived from the smoothed average of the DX, or Directional Movement Index.
Importance in Trading
Understanding the strength of a trend is crucial in trading. A strong trend, whether bullish or bearish, provides opportunities for traders to capitalize on sustained movements.
Components of the ADX Indicator
Before delving into the application, one must understand the ADX’s foundational components. At its core, the ADX comprises three lines: the ADX line itself, and two additional lines called the Positive Directional Indicator (+DI) and the Negative Directional Indicator (-DI).
These lines provide insight into the direction of the trend. When +DI is above -DI, it suggests a potential upward trend. Conversely, when -DI is above +DI, it can be indicative of a potential downtrend.
The ADX line measures the strength of the trend. However, it doesn’t distinguish between uptrends and downtrends. That’s where the +DI and -DI come into play. Together, they offer traders a comprehensive view of the market’s direction and momentum.
It’s crucial to remember that while these indicators offer insight, they’re not foolproof. Forex trading inherently involves risk, and the ADX should be used in conjunction with other indicators and strategies for the best results.
How to Set Up the ADX Indicator on Your Trading Platform
Setting up the ADX on your trading platform, like MT4 or MT5, is typically straightforward. While the exact steps can vary depending on the platform, the general process remains consistent.
Start by navigating to the ‘indicators’ or ‘tools’ section of your platform. Here, you’ll likely find the ADX listed under ‘Trend Indicators’ or a similar category. Once selected, a window should appear where you can adjust settings, like the period (with 14 days being standard).
After configuring the settings to your preference, the ADX, +DI, and -DI lines should appear on your chart. Some platforms even offer color-coding options for better visibility.
Once set up, it’s crucial to spend time observing how the ADX behaves in different market conditions. Familiarizing yourself with its movements will allow for more informed trading decisions in the future.
Interpreting ADX Values: From Weak to Strong Trends
Levels of the ADX
Interpreting the ADX values is key to understanding market trends. Here’s a basic breakdown:
- 0-25: Weak Trend
- 25-50: Strong Trend
- 50-75: Very Strong Trend
- 75-100: Extremely Strong Trend
How to Read the ADX?
A rising ADX means that the trend is getting stronger, while a falling ADX could mean that the trend is weakening or that the market is not moving in any direction. For example, an ADX value below 20 often suggests that there’s no significant trend, and the market may be moving sideways. Conversely, values above 25 usually indicate a strong trend in the direction signaled by the +DI and -DI lines.
Significance in Trading
In situations where the ADX is high, traders might consider implementing trend-following strategies. In contrast, a low ADX reading suggests that range-bound or counter-trend strategies might be more appropriate.
However, high ADX values don’t always mean it’s the perfect time to enter or exit a trade. It’s just an indication of trend strength. Always consider other technical indicators and market news before making a trading decision.
How to Use ADX Indicator With Your Trading Strategy
Because it is so flexible, the ADX can be used with various trading strategies for better results.
Confirming Trend Strength
Before entering a trade based on other technical analysis, checking the ADX can provide additional confirmation. If the trend strength is strong, it can add confidence to the trade.
Combining with Moving Averages
Another common strategy is to use the ADX together with moving averages. If the ADX indicates a strong trend and price is above a rising moving average, it may reinforce a bullish stance.
Stop-loss Placement
A rising ADX might suggest tighter stop loss placements, as it implies that the prevailing trend is strong and likely to continue. Conversely, in a weaker trend, traders might consider wider stop-loss margins.
Timeframe Consideration
Different timeframes can give varying ADX values. For instance, a daily chart might indicate a strong trend while an hourly chart does not. Aligning strategies with the best time frame to trade can be crucial for success.
Combining the ADX with Other Technical Indicators
The ADX is a flexible indicator and can be combined with other technical indicators for a more holistic trading strategy. One popular combination is using the ADX with moving averages. When the ADX indicates a strong trend, and the price is above a moving average, it might suggest a good buying opportunity.
Similarly, the ADX can be paired with the RSI (Relative Strength Index) to understand overbought or oversold conditions in conjunction with trend strength. If the ADX shows a strong upward trend and the RSI indicates that the asset is oversold, it might be an opportunity to buy.
Remember, no indicator is perfect. Combining the ADX with other tools can help mitigate risks and improve the chances of a successful trade.
Common Mistakes to Avoid When Using the ADX Indicator
While the ADX is a powerful indicator, traders often make mistakes when interpreting its signals.
Relying Solely on the ADX
While the ADX is powerful, it should not be used in isolation. Combining it with other technical tools can provide a more comprehensive view of the market.
Misinterpreting the ADX Value
A common misconception is that a very high ADX value (e.g., above 70) always indicates an overextended trend that’s about to reverse. This is not necessarily the case; a high ADX indicates trend strength, but not its end.
Ignoring Choppy Markets
In sideways or choppy markets, the ADX can often hover around the 20 level. Ignoring these conditions and solely focusing on the ADX can lead to false signals.
Over-Optimizing Strategies
Trying to fine-tune a strategy based on past ADX values can lead to over-optimization. It’s essential to remain flexible and adapt to current market conditions.
Misunderstanding the Purpose
The ADX doesn’t predict price direction. It merely gauges trend strength. Confusing the two can lead to misguided trading decisions.
Conclusion
The ADX is a valuable indicator that can significantly enhance a trader’s insight into market trends. Learning how to use ADX indicator correctly and in combination with other technical indicators, it can offer valuable insights and improve trading strategies. Remember to always stay informed, be patient, and never rely on a single tool for decision-making.
FAQs
1. How is the ADX different from other trend indicators in Forex?
The ADX is unique as it solely measures the strength of a trend rather than its direction. Many other trend indicators, like moving averages, might give signals about the trend’s direction, but the ADX quantifies how strong or weak that trend is.
2. Can beginners in Forex trading easily adapt to using the ADX?
Absolutely! The ADX, due to its bounded nature and straightforward interpretation, is beginner-friendly. However, as with any tool, practice and continuous learning will enhance its effective application.
3. Is the ADX effective for both short-term and long-term trading strategies?
While the ADX can be adapted for various time frames, it’s crucial to adjust the settings accordingly. For instance, short-term traders might use a shorter period for the ADX, while long-term traders might opt for a longer one.
4. How frequently should I check the ADX when I’m trading?
The frequency depends on your trading strategy. Day traders might check the ADX multiple times within a day, while swing or positional traders might review it less often. Always ensure it aligns with your overall trading plan.
5. Can I use the ADX for assets other than Forex?
Yes, the ADX is versatile and can be applied to various asset classes, including stocks, commodities, and cryptocurrencies. Its primary function remains the same: to measure the strength of a trend.


