
Understanding forex chart patterns can make the difference between success and failure in trading. These patterns offer powerful signs about market trends and potential reversals, giving savvy traders a leg up in making profitable decisions.
What are Forex Chart Patterns?
Chart patterns are a fundamental tool in technical analysis. They are price movement patterns that traders utilize to understand market trends and predict future price movements. As patterns form and shape over time, they indicate the behaviors of buyers and sellers, which is a reflection of market psychology.
Searching for these chart patterns regularly and studying the charts will help the trader learn and spot potential upcoming price movements for the formulation of profitable forex trading strategies.
12 Most Popular Forex Chart Patterns
There are various forex chart patterns used by traders worldwide. Each carries its unique signal and interpretation. Here we explore some of the most common used ones.
1. Head and Shoulders
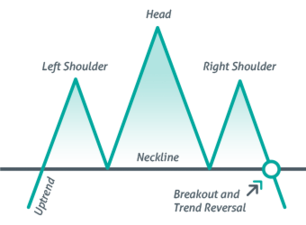
One of the most reliable chart patterns in Forex trading, the Head and Shoulders pattern signals a potential reversal from a bullish to a bearish trend. The pattern consists of three peaks – a higher peak (head) between two lower ones (shoulders), resembling a human silhouette.
2. Inverse Head and Shoulders
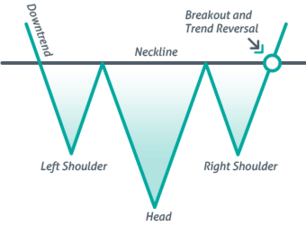
As the mirror image of the Head and Shoulders pattern, the Inverse Head and Shoulders signals a reversal from a bearish to a bullish trend. This pattern is characterized by one deep valley (head) between two shallower ones (shoulders).
3. Double Tops and Bottoms
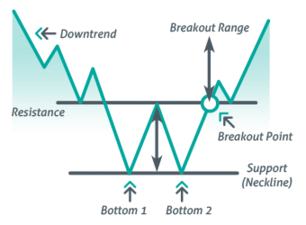
Double Tops occur when the price hits a certain level twice but cannot break through, suggesting a reversal from a bullish to a bearish trend. Conversely, Double Bottoms happen when the price hits a particular low twice and indicates a reversal from a bearish to a bullish trend.
4. Triple Tops and Bottoms
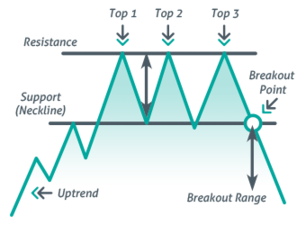
These patterns are similar to Double Tops and Bottoms, but the price hits a certain level three times. A Triple Top signals a bullish to bearish reversal, while a Triple Bottom suggests a bearish to bullish reversal.
5. Ascending Triangle

This pattern is formed by a flat resistance line and an ascending trend line. It often indicates a continuation of a bullish trend and suggests that the price is likely to break upwards.
6. Descending Triangle

The Descending Triangle is the inverse of the Ascending Triangle. Formed by a flat support line and a descending trend line, it often signals a continuation of a bearish trend and suggests a likely downward price break.
7. Symmetrical Triangle
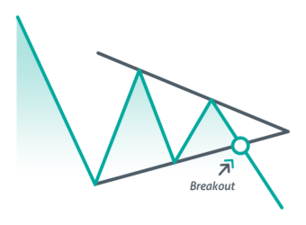
Formed by converging trend lines, the Symmetrical Triangle suggests that the market is undecided. A break above the upper trend line indicates a bullish trend, while a break below the lower trend line suggests a bearish trend.
8. Pennant

Pennants are continuation patterns that appear in the middle of a trend and are marked by converging trend lines, similar to a symmetrical triangle. They’re usually accompanied by high trade volumes and signify brief pauses before the trend continues.
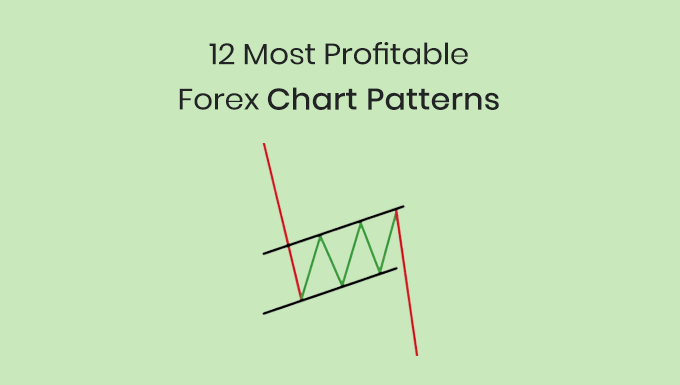
9. Flag

A Flag pattern is a small rectangle pattern that slopes against the previous trend. If the previous trend was up, then the flag would slope down. If the trend was down, then the flag would slope up. It’s another continuation pattern, suggesting the previous trend will resume.
10. Cup and Handle
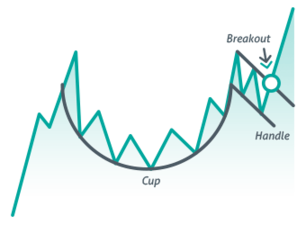
The Cup and Handle pattern represents a bullish continuation pattern that begins with a cup formation followed by a handle. It’s an indication that the price may break upwards, resuming the previous bullish trend.
11. Rectangles
Rectangles are continuation patterns that form when price moves between parallel support and resistance lines. Once a breakout from these lines occurs, the previous trend is likely to continue.
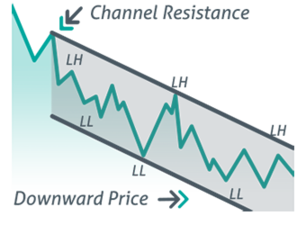
12. Wedges

Rising and falling wedges are reversal patterns. They are formed when the market consolidates between sloping support and resistance lines. Rising wedges typically result in a bearish breakout, while falling wedges usually lead to a bullish breakout.
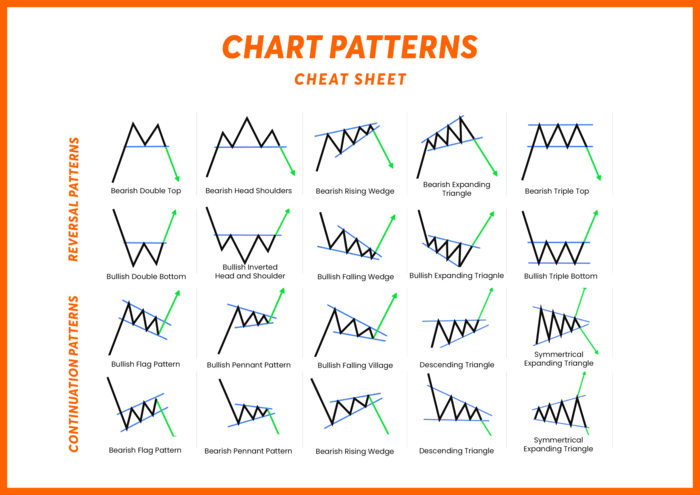
Forex Chart Patterns Cheat Sheet PDF
Mastering these chart patterns can set you on the path to profitable trades. Here is a forex chart cheat sheet of the most popular forex chart patterns that you can download and use.
Applying Forex Chart Patterns
While understanding the various chart patterns is a great start, knowing how to apply them is key to successful trading.
Chart Pattern Analysis
Forex chart pattern analysis involves studying past patterns to understand the possible future movements. With careful analysis, you can identify entry points, stop levels, and price targets, enhancing your forex trading strategies.
Risk Management
Using chart patterns also supports risk management. They provide defined risk points and help establish potential reward scenarios. Trading in alignment with these patterns can help minimize losses and increase potential returns.
Conclusion
Understanding and using forex chart patterns can be a game-changer in your forex trading journey. They provide valuable insight into market trends and potential reversals, offering a roadmap to success. While they aren’t foolproof, when used correctly, these patterns can significantly increase your odds of making profitable trades.
Mastering chart patterns takes time, patience, and practice, but the potential rewards are well worth the effort. So, keep studying, stay disciplined, and watch as your trading strategies evolve and your profitability grows.
FAQs
Q: What is a forex chart pattern?
A: Forex chart patterns are price movement patterns used by traders to understand market trends and predict future price movements.
Q: Why are chart patterns important in trading?
A: Chart patterns act as a roadmap for traders, helping them identify potential upcoming price movements and formulate profitable strategies.
Q: What are some popular forex chart patterns?
A: Some popular forex chart patterns include the Head and Shoulders, Double Tops and Bottoms, and Triangle patterns.
Q: How do I apply chart patterns in forex trading?
A: You apply chart patterns by studying past patterns and using that knowledge to understand possible future movements. They can help identify entry points, stop levels, and price targets.
Q: Are chart patterns always accurate?
A: While chart patterns can provide valuable insights, they are not always 100% accurate. Market conditions can change rapidly, and patterns should be used alongside other technical analysis tools for best results.


