
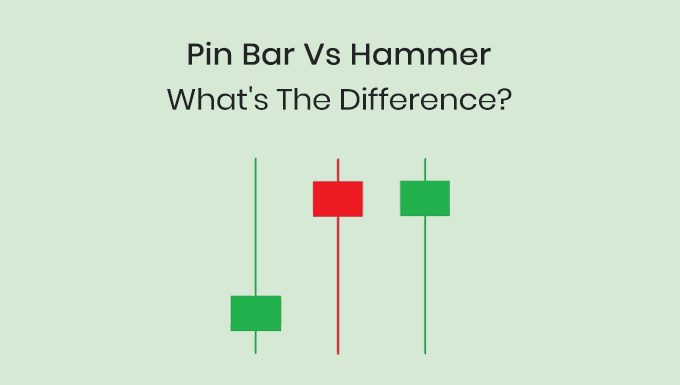
Pin bar and Hammer are 2 candlestick patterns that often cause a bit of confusion among traders. At first glance, they may look similar, but upon closer inspection, you’ll find they have key differences that can significantly affect your trading strategy. In this article, we’ll compare the Pin Bar vs Hammer and clarify which one you should use under different market conditions.
What is a Pin Bar?
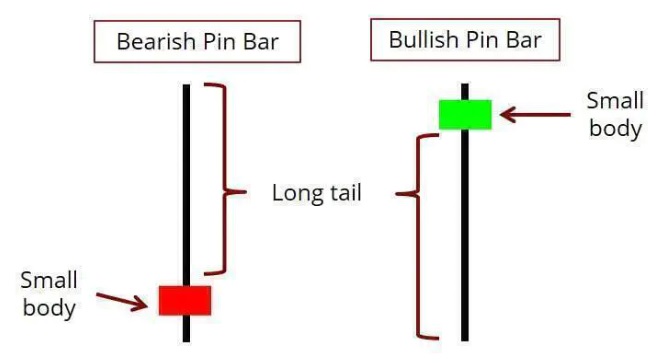
A Pin Bar is a single candlestick pattern that signals a potential reversal in the market direction. It has a long wick, or “tail,” with a small body. The wick is at least twice the size of the body, and it can appear at the top or bottom of the candle.
What is a Hammer?
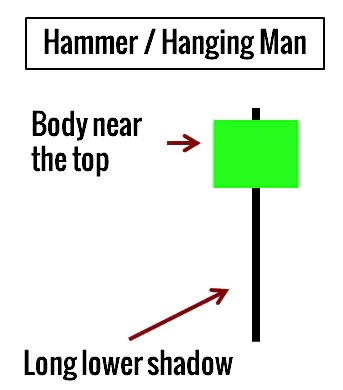
A Hammer is another single candlestick pattern but is primarily used to identify the end of a downtrend. It has a small body and a long lower wick, which should be at least twice the size of the body.
How Do Pin Bar and Hammer Differ in Structure?
Both patterns consist of a small body and a long wick, but their placement within the market trend and the direction of their wicks set them apart. The Pin Bar can have a long upper wick or a long lower wick, depending on whether it appears at the end of a bullish or bearish trend. This makes the Pin Bar versatile as it can signal both upward and downward reversals.
Conversely, the Hammer pattern typically appears at the bottom of a downtrend and has a long lower wick with a small body at the upper end of the candle. This indicates a potential bullish reversal. The Hammer pattern does not typically appear at the top of an uptrend; if it does, it’s often called an “Inverted Hammer” and carries different implications.
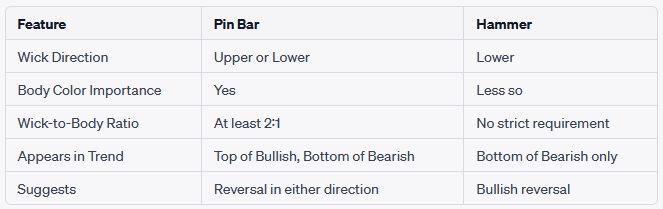
Moreover, the color of the candle body in a Hammer pattern is not as crucial as it is in a Pin Bar pattern. In a Hammer, whether the body is bullish (usually green or white) or bearish (usually red or black) has less impact on its effectiveness as a bullish reversal indicator. In a Pin Bar, however, a bullish Pin Bar will typically have a green body, while a bearish Pin Bar will have a red body, lending more weight to the directional bias.
Another key feature is the ratio of the wick to the body. In a Pin Bar, the length of the wick should be at least twice the size of the body for the pattern to be considered valid. The Hammer, while also featuring a long wick, doesn’t have as stringent requirements about the wick-to-body ratio.
Here’s a simple table to help you differentiate:
How to Interpret Pin Bar vs Hammer Patterns?
Interpreting the Pin Bar and Hammer candlestick patterns requires a good understanding of market context, volatility, and trader sentiment. While the basic structures of these patterns are easy to identify, the context in which they appear can significantly impact their reliability.
Firstly, always consider the trend that precedes the pattern. A Pin Bar is more reliable when it appears at the end of a strong trend, indicating a potential reversal. Likewise, a Hammer is more effective when it appears after a significant downtrend. The psychology behind this is that the market has reached a point where it can no longer sustain the prevailing trend, making a reversal likely.
Another important factor to consider is the volume of trading when these patterns appear. High trading volume can confirm the validity of a Pin Bar or Hammer pattern. A high volume of trades during the formation of these patterns indicates strong interest from traders and increases the likelihood of a reversal.
Traders should also pay attention to the time frame on which the pattern appears. Generally, patterns appearing on longer time frames, such as daily or weekly charts, are considered more reliable than those appearing on shorter time frames like hourly charts. This is because longer time frames encapsulate more data and are less prone to noise and false signals.
Additionally, consider the size of the wick relative to the body. For the Pin Bar, a wick that is at least twice the size of the body is generally considered a stronger indicator of a reversal. In the case of the Hammer, while the ratio is not as crucial, a long lower wick is still a strong signal for a bullish reversal.
Another aspect to consider is the location of the pattern on support and resistance levels. If a Pin Bar forms near a known resistance level, it may be a stronger indicator of a bearish reversal. Similarly, a Hammer pattern near a support level is a strong bullish signal.
Let’s review some key points for interpretation:
- Examine the preceding trend.
- Look at trading volume.
- Consider the time frame.
- Assess the wick-to-body ratio.
- Check support and resistance levels.
By integrating these factors into their trading strategies, traders can improve their odds of successfully capitalizing on Pin Bar and Hammer patterns.
What Markets Are Suitable for Pin Bar and Hammer?
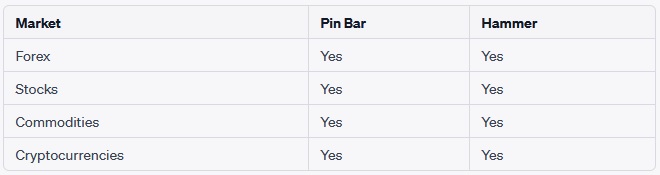
While the Pin Bar and Hammer patterns are widely used in forex trading, their applications extend to other markets as well. From stocks to commodities to cryptocurrencies, these patterns can provide valuable insights across various asset classes.
In forex markets, the Pin Bar and Hammer are especially useful due to the high liquidity and 24-hour trading cycle, allowing for more candlestick patterns to form and thus more opportunities for these patterns to appear. Forex traders often use these patterns in combination with other indicators like moving averages and oscillators for more robust trading strategies.
Stock markets also provide fertile ground for these patterns. Given that stocks are influenced by a multitude of factors like earnings reports, market sentiment, and economic indicators, Pin Bar and Hammer patterns can serve as strong confirmatory signals when these external factors align.
In the commodities market, traders use these patterns to gain an edge in trading assets like gold, oil, and agricultural products. The patterns are especially useful in markets that are prone to sudden price fluctuations due to geopolitical or economic events.
Cryptocurrency markets are known for their extreme volatility, making them a good fit for traders looking to capitalize on rapid price movements. Both Pin Bar and Hammer patterns can signal crucial reversal points in these fast-moving markets.
How Reliable Are Pin Bar and Hammer Patterns?
The reliability of Pin Bar vs Hammer patterns varies depending on the context in which they appear. No pattern can provide a 100% accurate prediction of market movements, but some conditions increase the reliability of these patterns.
One of the key factors influencing reliability is the current market trend. For example, a Hammer pattern is more reliable if it appears after an extended downtrend. This is because, after a prolonged bearish phase, traders are looking for signs of a reversal, and a Hammer can provide that signal.
Similarly, the time frame in which the pattern appears also impacts its reliability. Patterns that appear on longer time frames like daily or weekly charts are generally considered more reliable than those on hourly or 4-hour charts. This is because longer time frames contain more data, making them less susceptible to market noise.
The presence of other technical indicators can also enhance the reliability of these patterns. For instance, if a Pin Bar pattern appears when the Relative Strength Index (RSI) is in overbought or oversold territory, it may increase the pattern’s reliability as a reversal indicator.
Additionally, trading volume plays a crucial role. A high trading volume during the formation of a Pin Bar or Hammer pattern can serve as a confirmation of the pattern’s reliability. High volume indicates strong trader interest and lends more weight to the pattern as a reversal signal.
Lastly, the location of these patterns concerning support and resistance levels can provide additional confirmation. Patterns that form near these crucial levels often carry more weight and can be considered more reliable.
Factors that contribute to reliability:
- Preceding market trend
- Time frame
- Confirmatory indicators
- Trading volume
- Support and resistance levels
While Pin Bar and Hammer patterns are among the more reliable candlestick patterns, traders should always use them in conjunction with other indicators and strategies for the best results.
How to Trade with Pin Bar and Hammer Patterns?
Trading with Pin Bar vs Hammer patterns involves a well-thought-out strategy that includes risk management, entry and exit points, and the use of other technical indicators for confirmation. Here’s a step-by-step guide on how to trade with these patterns:
Step 1: Identify the Pattern
Scan your charts to identify a clear Pin Bar or Hammer pattern. Make sure the pattern conforms to the general guidelines concerning wick length, body size, and location within a trend.
Step 2: Confirm with Additional Indicators
Use other technical indicators like RSI, moving averages, or Fibonacci retracements to confirm the pattern’s validity. This can provide additional assurance before you enter a trade.
Step 3: Assess Trading Volume
Look for high trading volume during the pattern formation. High volume can confirm the pattern and indicate strong trader interest.
Step 4: Check Support and Resistance Levels
Identify key support and resistance levels near the pattern. A pattern that forms near these levels is generally more reliable.
Step 5: Determine Entry and Exit Points
Based on your analysis, determine your entry point, stop-loss level, and take-profit point. Your entry point should be near the close of the pattern candle, and the stop-loss should be set beyond the pattern’s wick.
Step 6: Risk Management
Calculate the amount you are willing to risk on the trade. Stick to a consistent risk-to-reward ratio to manage your risks effectively.
Step 7: Execute the Trade
Once all conditions are met, execute the trade. Monitor it closely to adapt to any unexpected market movements.
Step 8: Review and Learn
After the trade is completed, review your decisions. Analyze what worked and what didn’t to improve your future trades.
By following these steps, traders can systematically approach trading with Pin Bar and Hammer patterns, improving their chances of success.
Common Mistakes When Trading Pin Bar and Hammer?
Even experienced traders can make mistakes when trading with Pin Bar and Hammer patterns. Being aware of these common pitfalls can help traders avoid costly errors.
Ignoring Market Context
One of the most common mistakes is ignoring the broader market context in which these patterns appear. Even a perfect Pin Bar or Hammer pattern can fail if it appears in a ranging or consolidative market rather than at the end of a defined trend.
Overlooking Volume
Ignoring trading volume can be a costly oversight. Low volume during the formation of these patterns can result in false signals, leading to failed trades.
Poor Risk Management
Some traders become overconfident when they spot a Pin Bar or Hammer pattern and neglect proper risk management techniques. Always use stop-loss orders and maintain a consistent risk-to-reward ratio.
Ignoring Time Frame
Patterns that appear on lower time frames are generally less reliable than those on higher time frames. Trading solely based on patterns formed on lower time frames can lead to less successful outcomes.
Disregarding Additional Indicators
Failing to use additional indicators for confirmation can result in less reliable trades. Indicators like RSI or moving averages can provide valuable confirmatory signals.
Not Checking Support and Resistance
Overlooking key support and resistance levels can result in a less effective trading strategy. Always consider these levels when planning your trades.
Overtrading
Sometimes traders get excited after spotting multiple patterns and end up overtrading. This can erode profits and increase trading costs.
Emotional Trading
Reacting emotionally, especially after a losing trade, can be detrimental. Stick to your strategy and avoid making impulsive decisions based on emotions.
By being aware of these common mistakes, traders can significantly improve their trading performance when using Pin Bar vs Hammer patterns.
Conclusion
Both the Pin Bar and Hammer are powerful candlestick patterns that can provide valuable insights into market reversals. While they may look similar, understanding their key differences will allow you to apply them more effectively in your trading strategy. To sum it up, use Pin Bars for more flexible reversal signals and Hammers for more specific bullish reversals at the end of downtrends. Whether you are trading forex, stocks, commodities, or cryptocurrencies, applying these pin bar vs hammer patterns can give you profitable trading opportunities.
FAQs
1. What are Pin Bar and Hammer patterns in trading?
Pin Bar and Hammer patterns are types of candlestick patterns used in trading to predict price reversals. The Pin Bar is characterized by a small body and a long wick pointing in the direction of the trend reversal, while the Hammer pattern has a small body and a long lower wick, often signaling an upward reversal.
2. What’s the significance of the color of a Pin Bar or Hammer candle?
The color indicates the market sentiment during the formation of the candle. A bullish Pin Bar or Hammer will often be green or white, indicating buying pressure, whereas a bearish one will be red or black, indicating selling pressure.
3. Can Pin Bar and Hammer patterns be used for both long and short trades?
Yes, these patterns can indicate both bullish and bearish reversals, and thus can be used for entering both long and short positions.
4. How do I set my stop-loss and take-profit levels when trading these patterns?
The stop-loss is usually set just beyond the long wick of the Pin Bar or Hammer, while the take-profit level varies depending on your trading strategy and risk tolerance.
5. What role does market volatility play in the effectiveness of Pin Bar and Hammer patterns?
Increased volatility can lead to false signals, so it’s essential to confirm these patterns with other technical indicators, especially during high-volatility periods.


