Home » Forex Education » Principles of Technical Analysis: A Beginner’s Guide
Principles of Technical Analysis: A Beginner’s Guide
Technical analysis is an approach used to forecast a market’s future price movement by examining past trends and patterns on charts. Learn the principles of technical analysis and how it contrasts with fundamental analysis.
Traders use various methods to carry out technical analysis, but most rely on historical price charts combined with technical indicators or oscillators. The goal of learning the principles of technical analysis is to identify recognizable patterns that help traders determine the best times and prices for entering and exiting the market.
Technical analysis charts typically display price movements as candlesticks, which convey essential information about a market’s price within a specific timeframe:
The candlestick’s color indicates if the price has increased (green) or decreased (red)
The bars represent the opening and closing prices
The wicks display the highest and lowest prices
Technical analysts employ numerous indicators on charts. Common strategies involve using moving averages, Fibonacci retracements, and Bollinger bands to pinpoint entry and exit prices for trades. However, the chosen indicators vary based on individual preferences, trading styles, markets, and timeframes.
Technical analysts often test their strategies on past market data before risking actual capital. This process, called backtesting, entails applying a strategy to a market’s historical price movements using real data from various markets. If backtesting proves successful, traders and analysts gain the confidence to apply the technical analysis in live trading situations.
Some traders become so convinced of their strategy’s effectiveness that they automate it. Automating a technical analysis strategy involves creating algorithms that execute trades with minimal human intervention.
Principles of Technical Analysis
Technical analysis finds its roots in Dow theory, a collection of principles developed by Charles Dow between 1851 and 1902. These principles guide traders on understanding market actions, such as types of trends, phases of price changes, and how news affects the market.
While modern technical analysis has advanced in terms of technology and automation capabilities, Dow’s approach remains central to the practice.
Technical analysis is based on several key assumptions:
1. Charts narrate a story. Experts of technical analysis believe they predict the future price movement using historical prices. However, it’s generally recommended to combine fundamental and technical analysis to ensure a comprehensive understanding of the market before making trades.
2. Market prices follow trends. Dow theory identifies three trend timeframes: primary movement (lasting from a year to several years), secondary reaction (spanning from ten days to a year), and minor movement (ranging from seconds to days).
3. Historical trends recur. Analysts believe that price patterns tend to repeat in the future. As a result, they study a market’s past price changes and use this information to determine when to open and close trades, aiming to maximize their profits.
How to Use Technical Analysis?
Technical analysis is applicable to both short and long-term trading. Long-term investors might employ technical indicators to determine when to purchase shares for their portfolios, while short-term day traders could use them to spot quick profit-making opportunities.
Trading time frame plays a vital role in successful trading, and technical analysis assists in optimizing trade timing to boost profits and reduce losses.
Technical analysis can be applied to nearly any market, requiring only a price chart and access to some technical indicators. Therefore, whether you’re interested in trading stocks, indices, forex, or cryptocurrencies, technical analysis can be beneficial.
Types of Technical Analysis Charts
One of the key tools in technical analysis is the use of charts, which help traders visualize historical price data and identify potential trends and patterns. In this easy-to-understand guide, we will explore various types of technical analysis charts, so you can gain a better understanding of this powerful trading tool.
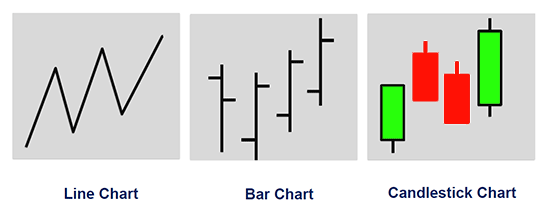
1. Line Charts: Line charts are the simplest and most common type of chart used in technical analysis. They consist of a single line connecting the closing prices of an asset over a specified time period. Line charts provide a clear and straightforward view of the overall price trend, making it easy for beginners to identify support and resistance levels.
2. Bar Charts: Bar charts, also known as OHLC (open, high, low, close) charts, provide more information than line charts. Each vertical bar represents a specific time period (such as a day, week, or month) and shows the open, high, low, and close prices of an asset during that time. The top of the bar indicates the highest price, while the bottom represents the lowest price. Bar charts help traders identify price patterns and potential reversal points.
3. Candlestick Charts:Candlestick charts, originating from Japan, are similar to bar charts but use a more visually appealing representation of price data. Each candlestick represents a specified time period and shows the open, high, low, and close prices of an asset. The body of the candlestick represents the range between the open and close prices, while the wicks (thin lines) extending above and below the body indicate the high and low prices. Candlesticks are color-coded to show whether the closing price was higher or lower than the opening price, making it easy to identify bullish and bearish trends.
4. Point and Figure Charts: Point and figure charts are unique in that they only focus on price changes, ignoring time altogether. These charts use a series of X’s and O’s to represent rising and falling prices, respectively. By removing the time element, point and figure charts help traders focus on significant price movements and filter out market noise, making them particularly useful for long-term trend analysis.
5. Renko Charts: Similar to point and figure charts, Renko charts also ignore time and focus solely on price movements. Renko charts use “bricks” of equal size to represent price movements, with each brick representing a predetermined price increment. New bricks are added when the price moves beyond the set increment, resulting in a chart that emphasizes trends and helps filter out minor price fluctuations.
Example of Technical Analysis
Let’s explore an example of technical analysis in forex trading to help you better understand how these methods can be applied in practice.
Identifying a trend: The first step in technical analysis is to identify the prevailing trend in the market. For this example, let’s consider the EUR/USD currency pair. To analyze its trend, you can use a simple moving average (SMA) indicator, which calculates the average price over a specified period. By plotting a 50-day SMA and a 200-day SMA on a daily chart, you can determine whether the market is in an uptrend, downtrend, or range-bound.
If the 50-day SMA is above the 200-day SMA, it’s an indication of an uptrend.
If the 50-day SMA is below the 200-day SMA, it’s a sign of a downtrend.
If both SMAs are moving sideways and intertwining, the market is likely range-bound.
Support and resistance levels: Next, you should identify key support and resistance levels on the chart. These are price points where the market has previously reversed or consolidated, and they can act as potential barriers to future price movements.
Support levels are price points at which buying pressure tends to outweigh selling pressure, potentially causing the price to bounce back up.
Resistance levels are price points at which selling pressure tends to outweigh buying pressure, potentially causing the price to reverse downward.
Using trendlines and chart patterns: Trendlines and chart patterns can provide valuable insight into the market’s behavior. For instance, you can draw a trendline by connecting higher lows in an uptrend or lower highs in a downtrend, which can help you visualize the trajectory of the market. Additionally, you can identify chart patterns like double tops or bottoms, head and shoulders, or triangles, which can signal potential trend reversals or continuations.
Applying technical indicators: Finally, you can use technical indicators to supplement your analysis. Some popular indicators include the Relative Strength Index (RSI), Moving Average Convergence Divergence (MACD), and Bollinger Bands.
RSI measures the speed and change of price movements, with values ranging from 0 to 100. An RSI above 70 indicates overbought conditions, while an RSI below 30 suggests oversold conditions.
MACD helps identify potential trend reversals by comparing short-term and long-term price momentum. A bullish signal occurs when the MACD line (12-day EMA minus 26-day EMA) crosses above the signal line (9-day EMA of the MACD line), while a bearish signal occurs when the MACD line crosses below the signal line.
Bollinger Bands consist of a middle line (SMA) and two outer bands, which are calculated by adding or subtracting a standard deviation from the SMA. When the bands tighten, it may indicate a period of low volatility, followed by a potential breakout.
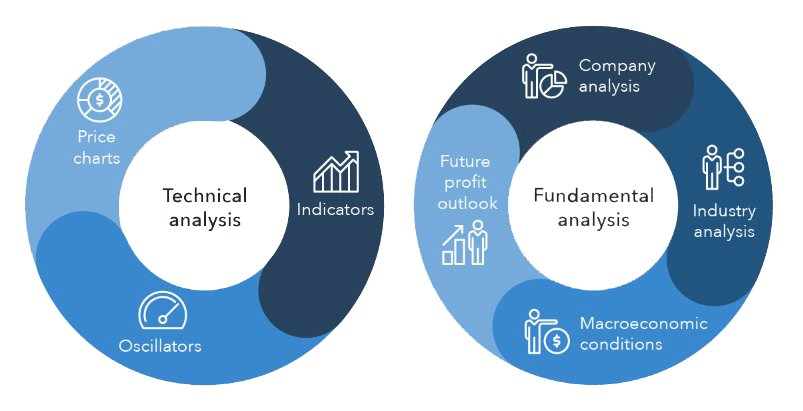
Technical Analysis Vs Fundamental Analysis
There are numerous distinctions between technical and fundamental analysis. Mainly, instead of analyzing past price movements like technical analysis, fundamental analysis considers various internal and external factors.
A fundamental analyst uses this information to determine an asset’s worth and assigns it a ‘fair value’ – the value of an asset if all relevant information was factored into the market price. If the asset’s current market price is below the analyst’s perceived worth, they’ll buy the asset. Conversely, if the price is above their perceived value, they’ll sell it.
For instance, imagine a fundamental analyst and a technical analyst both evaluating GBPUSD currency pair for trading. The fundamental analyst might assess both USA and UK recent economic indicators, the performance of the technology sector, and the overall economic health to determine GBPUSD currency pair strength.
In contrast, a technical analyst would focus solely on GBPUSD currency pair chart, using technical indicators to identify patterns that offer insights into the GBPUSD currency past behavior. They would then use this data to make assumptions about the currency’s future direction and trade accordingly.
At first glance, technical analysis might seem simpler than fundamental analysis, as it only requires examining a market’s chart instead of scrutinizing news, economic reports, and earnings releases. However, a successful technical trader may use numerous indicators and backtest their strategy to ensure its effectiveness before trading, so it’s not necessarily an easier option.
That said, most traders don’t exclusively rely on either technical or fundamental analysis; they use a combination of both to gain a well-rounded perspective.
For example, you could employ fundamental analysis to select the market you want to trade and then use technical analysis to determine the optimal time to open your position.
Limitations of Technical Analysis
Technical analysis is widely used, but it does have some limitations, such as:
Subjectivity: Indicators may display the same signal to two traders, but they might interpret the results differently.
Self-fulfilling prophecy: If many people trade using the same pattern, it could force the prediction to come true. While this can be advantageous, it may also make trade execution more challenging if everyone places the same orders.
Inaccuracy: Technical analysis isn’t always 100% accurate, and exceptions to the rule may occur. Unanticipated movements can lead to significant price swings as technical traders scramble to exit their positions.
Ignoring fundamentals: By not considering other factors that can influence market prices, technical analysis offers a limited market perspective. Although it can provide useful entry and exit points, unexpected news announcements or company reports can cause volatility.
Being aware of your strategy’s potential drawbacks is essential, and taking measures to prevent them from causing unnecessary losses is crucial.
Conclusion
Technical analysis is a valuable tool for traders and investors looking to understand market trends and make informed decisions. By studying historical price movements and using various chart patterns and indicators, you can develop a more comprehensive trading strategy. As a beginner, it’s essential to learn the principles of technical analysis and practice using these techniques in a demo trading environment before diving into live markets.
This website uses cookies to ensure you get the best experience on our website. Learn moreAccept
Manage consent
Privacy Overview
This website uses cookies to improve your experience while you navigate through the website. Out of these, the cookies that are categorized as necessary are stored on your browser as they are essential for the working of basic functionalities of the website. We also use third-party cookies that help us analyze and understand how you use this website. These cookies will be stored in your browser only with your consent. You also have the option to opt-out of these cookies. But opting out of some of these cookies may affect your browsing experience.
Necessary cookies are absolutely essential for the website to function properly. These cookies ensure basic functionalities and security features of the website, anonymously.
Cookie
Duration
Description
cookielawinfo-checbox-analytics
11 months
This cookie is set by GDPR Cookie Consent plugin. The cookie is used to store the user consent for the cookies in the category "Analytics".
cookielawinfo-checbox-functional
11 months
The cookie is set by GDPR cookie consent to record the user consent for the cookies in the category "Functional".
cookielawinfo-checbox-others
11 months
This cookie is set by GDPR Cookie Consent plugin. The cookie is used to store the user consent for the cookies in the category "Other.
cookielawinfo-checkbox-necessary
11 months
This cookie is set by GDPR Cookie Consent plugin. The cookies is used to store the user consent for the cookies in the category "Necessary".
cookielawinfo-checkbox-performance
11 months
This cookie is set by GDPR Cookie Consent plugin. The cookie is used to store the user consent for the cookies in the category "Performance".
viewed_cookie_policy
11 months
The cookie is set by the GDPR Cookie Consent plugin and is used to store whether or not user has consented to the use of cookies. It does not store any personal data.
Functional cookies help to perform certain functionalities like sharing the content of the website on social media platforms, collect feedbacks, and other third-party features.
Performance cookies are used to understand and analyze the key performance indexes of the website which helps in delivering a better user experience for the visitors.
Analytical cookies are used to understand how visitors interact with the website. These cookies help provide information on metrics the number of visitors, bounce rate, traffic source, etc.
Advertisement cookies are used to provide visitors with relevant ads and marketing campaigns. These cookies track visitors across websites and collect information to provide customized ads.