
Double bottom pattern is a popular technical analysis tool used by traders to identify potential trend reversals in the market. In this article, we will explore the double bottom technical analysis in detail, including what it is, how to identify it, and how to use it in your trading strategy.
What is Double Bottom Technical Analysis?
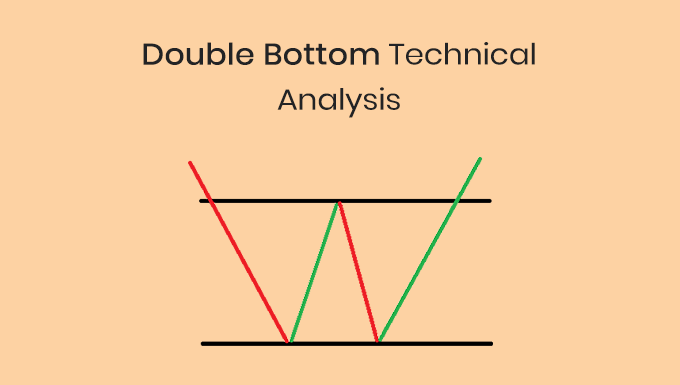
Double bottom technical analysis is a bullish chart pattern used in technical analysis to identify the reversal of a downtrend. It is formed when the price drops to a support level twice, bounces off the support level, and then starts to rise again. The two lows are usually at the same level, forming a “W” shape on the chart.
How to Identify a Double Bottom Pattern?
Identifying the double bottom pattern involves keen observation and understanding of the market.
Here are the key steps involved:
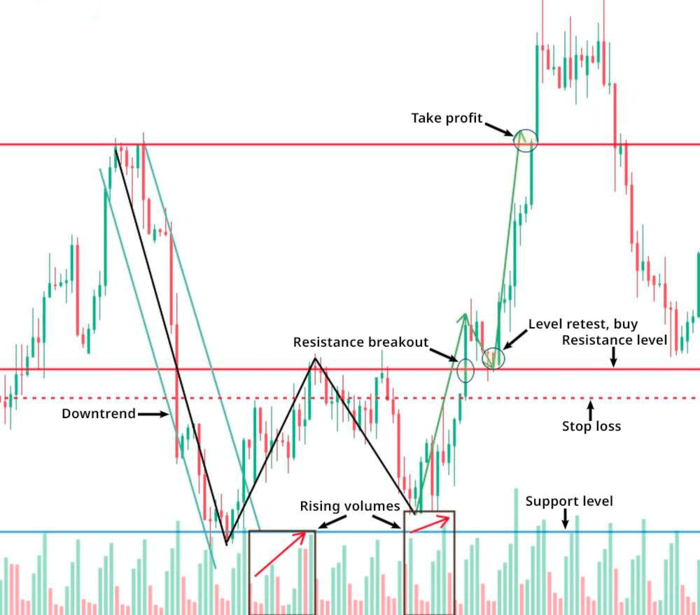
1. Look for a downtrend: It starts with a prior existing downtrend. The formation of a double bottom is a bullish reversal pattern which means it signals the reversal of a downward trend.
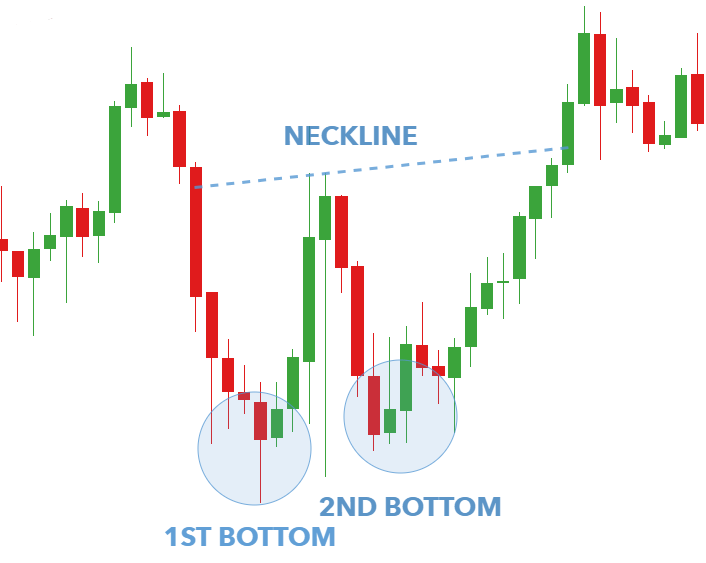
2. Identify the first bottom: The price falls from a peak, marking the first bottom. This is where the market takes a breather, and the price may consolidate for a bit before the next move.
3. Look for middle peak: After the first bottom, there’s a recovery in price, which forms the middle peak. It doesn’t breach the prior trend’s peak.
4. Identify the second bottom: Post the middle peak, the second bottom forms when the price drops to the support level again, but this time, it bounces off the support level, forming the second low of the “W” shape.
5. Look for confirmation: Finally, a breakthrough occurs. This happens when the price moves above the resistance level marked by the middle peak. It confirms the pattern and signifies a bullish market trend.
How to Trade Double Bottom Patterns?
Once you have identified a double bottom pattern, the next step is to trade it effectively. Here are the steps to trade double bottom patterns:
1. Buy at the breakout – Once the price breaks out above the neckline, it is a confirmation of the double bottom pattern. You can enter a long position and set a stop loss below the second low.
2. Set profit targets – You can set profit targets at the next resistance level or use a trailing stop to lock in profits as the price rises.
3. Manage risk – Always manage your risk by setting a stop loss and avoiding overtrading.
Double Bottom Pattern Example
Let’s take a look at an example of the double bottom pattern in action.
In the chart below, we can see the double bottom pattern forming in the price of EURUSD currency pair:
As we can see, the price of the currency pair was in a downtrend before forming the double bottom pattern. After the formation of the first bottom, followed by a peak and then the second bottom occurred again, indicating that the selling pressure had diminished. The price then broke above the peak confirming the pattern and indicating a potential trend reversal. A stop loss could be placed below the second bottom, with a target price based on the distance between the bottoms and the peak.
Advantages of Double Bottom Patterns
There are several advantages of trading double bottom patterns:
1. Easy to Spot – One of the primary advantages of trading double bottom patterns in forex is that they are easy to spot on the price chart. The double bottom pattern is formed when the price reaches a low point, bounces back up, and then falls again to the same low point. This creates a “W” shape on the chart, and it’s a clear indication of a reversal in the market. When you see a double bottom pattern forming, you can enter a long position and take advantage of the upcoming price increase.
2. Clear Entry and Exit Points – Double bottom patterns also offer clear entry and exit points for traders. The entry point is at the second bottom of the “W” shape, while the exit point is when the price breaks above the neckline. Traders can use these points to set their stop-loss and take-profit levels, which helps to minimize risk and maximize profits.
3. Can Be Used with Other Indicators – Another advantage of trading double bottom patterns in forex is that they can be used in conjunction with other technical indicators. For example, you can use the double bottom pattern to confirm a signal from an oscillator or moving average. This can increase the accuracy of your trades and help you make better-informed decisions.
4. High Reward-to-Risk Ratio – Finally, trading double bottom patterns in forex offers a high reward-to-risk ratio. Because the pattern has a reliable predictive capability and clear entry and exit points, traders can make trades with a high probability of success. This means that the potential reward is higher than the potential risk, making it a popular pattern for traders looking to make profitable trades.
Limitations of Double Bottom Technical Analysis
1. False breakouts – One of the biggest limitations of the double bottom technical analysis is the possibility of false breakouts. This happens when the price action creates a pattern that looks like a double bottom, but it fails to follow through with a bullish move. Traders should confirm the pattern with other technical indicators before making a trade.
2. Subjectivity – Another limitation of a double bottom pattern is the subjectivity involved in identifying the pattern. Since the pattern requires two distinct lows to form, there is some discretion involved in determining whether the pattern has formed. This can lead to different traders seeing different patterns and interpreting them in different ways.
3. Limited Usefulness – Lastly, the double bottom technical analysis has limited usefulness in certain market conditions. For example, in a strongly trending market, the pattern may not form at all, or it may not be as reliable. Additionally, in a market that is experiencing a lot of volatility or news events, the pattern may be less reliable as well.
4. Time Frame Dependency – The double bottom patterns are also time frame dependent. The pattern may look like a double bottom on a daily chart, but it may not look the same on a weekly or monthly chart. This means that traders need to be aware of the time frame they are using and how the pattern looks on that specific time frame.
Other Indicators to Use Confirm the Trade
When trading using double bottom technical analysis, it’s important to use other indicators and signals to confirm your trade. Here are a few to consider:
- Volume: High volume during the second bounce can be a strong confirmation that the price is likely to continue moving higher.
- Moving Averages: Using moving averages can help confirm the direction of the trend and give you an idea of when to enter or exit a trade.
- Support and Resistance Levels: Identifying support and resistance levels can help you determine when to enter or exit a trade.
- Momentum Indicators: Momentum indicators like the Relative Strength Index (RSI) or Moving Average Convergence Divergence (MACD) can help confirm the strength of the trend.
Double Bottom vs. Double Top Patterns
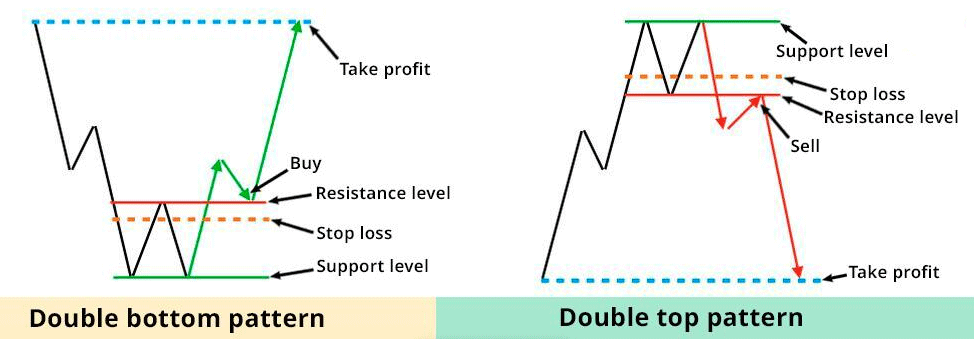
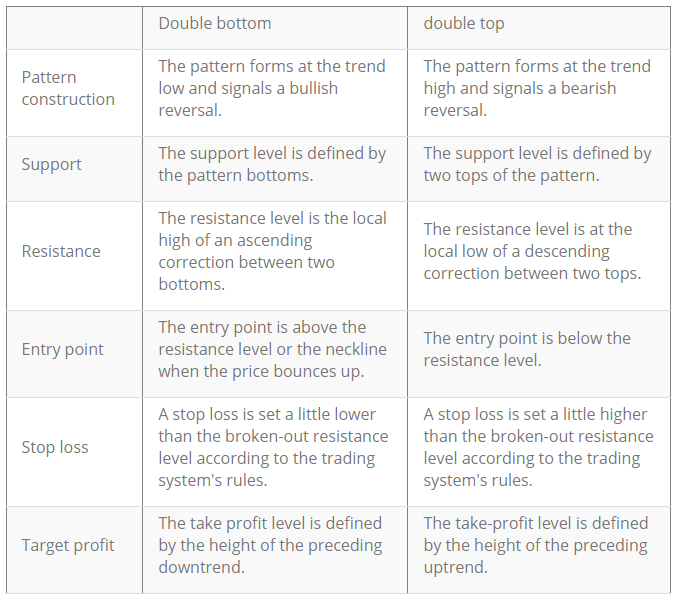
Double bottom and double top patterns are similar, but they have opposite meanings. Double bottom patterns indicate a bullish reversal, while double top patterns indicate a bearish reversal. Double top patterns are the opposite of double bottom patterns, as they form when the price rises to a resistance level twice, bounces off the resistance level, and then starts to fall again.
The table below compares these two patterns.
Conclusion
In conclusion, double bottom technical analysis is a powerful chart pattern for identifying bullish reversal patterns. By understanding how to identify and trade double bottom patterns, you can increase your chances of success in the forex market. Always remember to manage your risk and have a trading plan before entering any trade.
FAQs
Q: Can Double Bottom pattern be used in any market?
A: Yes, Double Bottom pattern can be used in any market, including stocks, commodities, and forex.
Q: Can Double Bottom pattern be combined with other technical indicators?
A: Yes, Double Bottom pattern can be confirmed with other technical indicators, such as volume and moving averages.
Q: How long does it take for a Double Bottom pattern to form?
A: Double Bottom pattern can take anywhere from a few days to several months to form, depending on the timeframe.
Q: Is Double Bottom pattern a guaranteed indicator of bullish reversal?
A: No, Double Bottom pattern is not a guaranteed indicator of bullish reversal. Traders should always confirm the pattern with other technical indicators before making a trade.
Q: Can the double bottom pattern fail?
A: Yes, no pattern or strategy is foolproof, and traders should always use proper risk management techniques when trading.


